
All statistical plots from the listener perception study. 85 listeners, 36 speakers. ← Back to the main project page.
Section 1: Overall Perception Accuracy
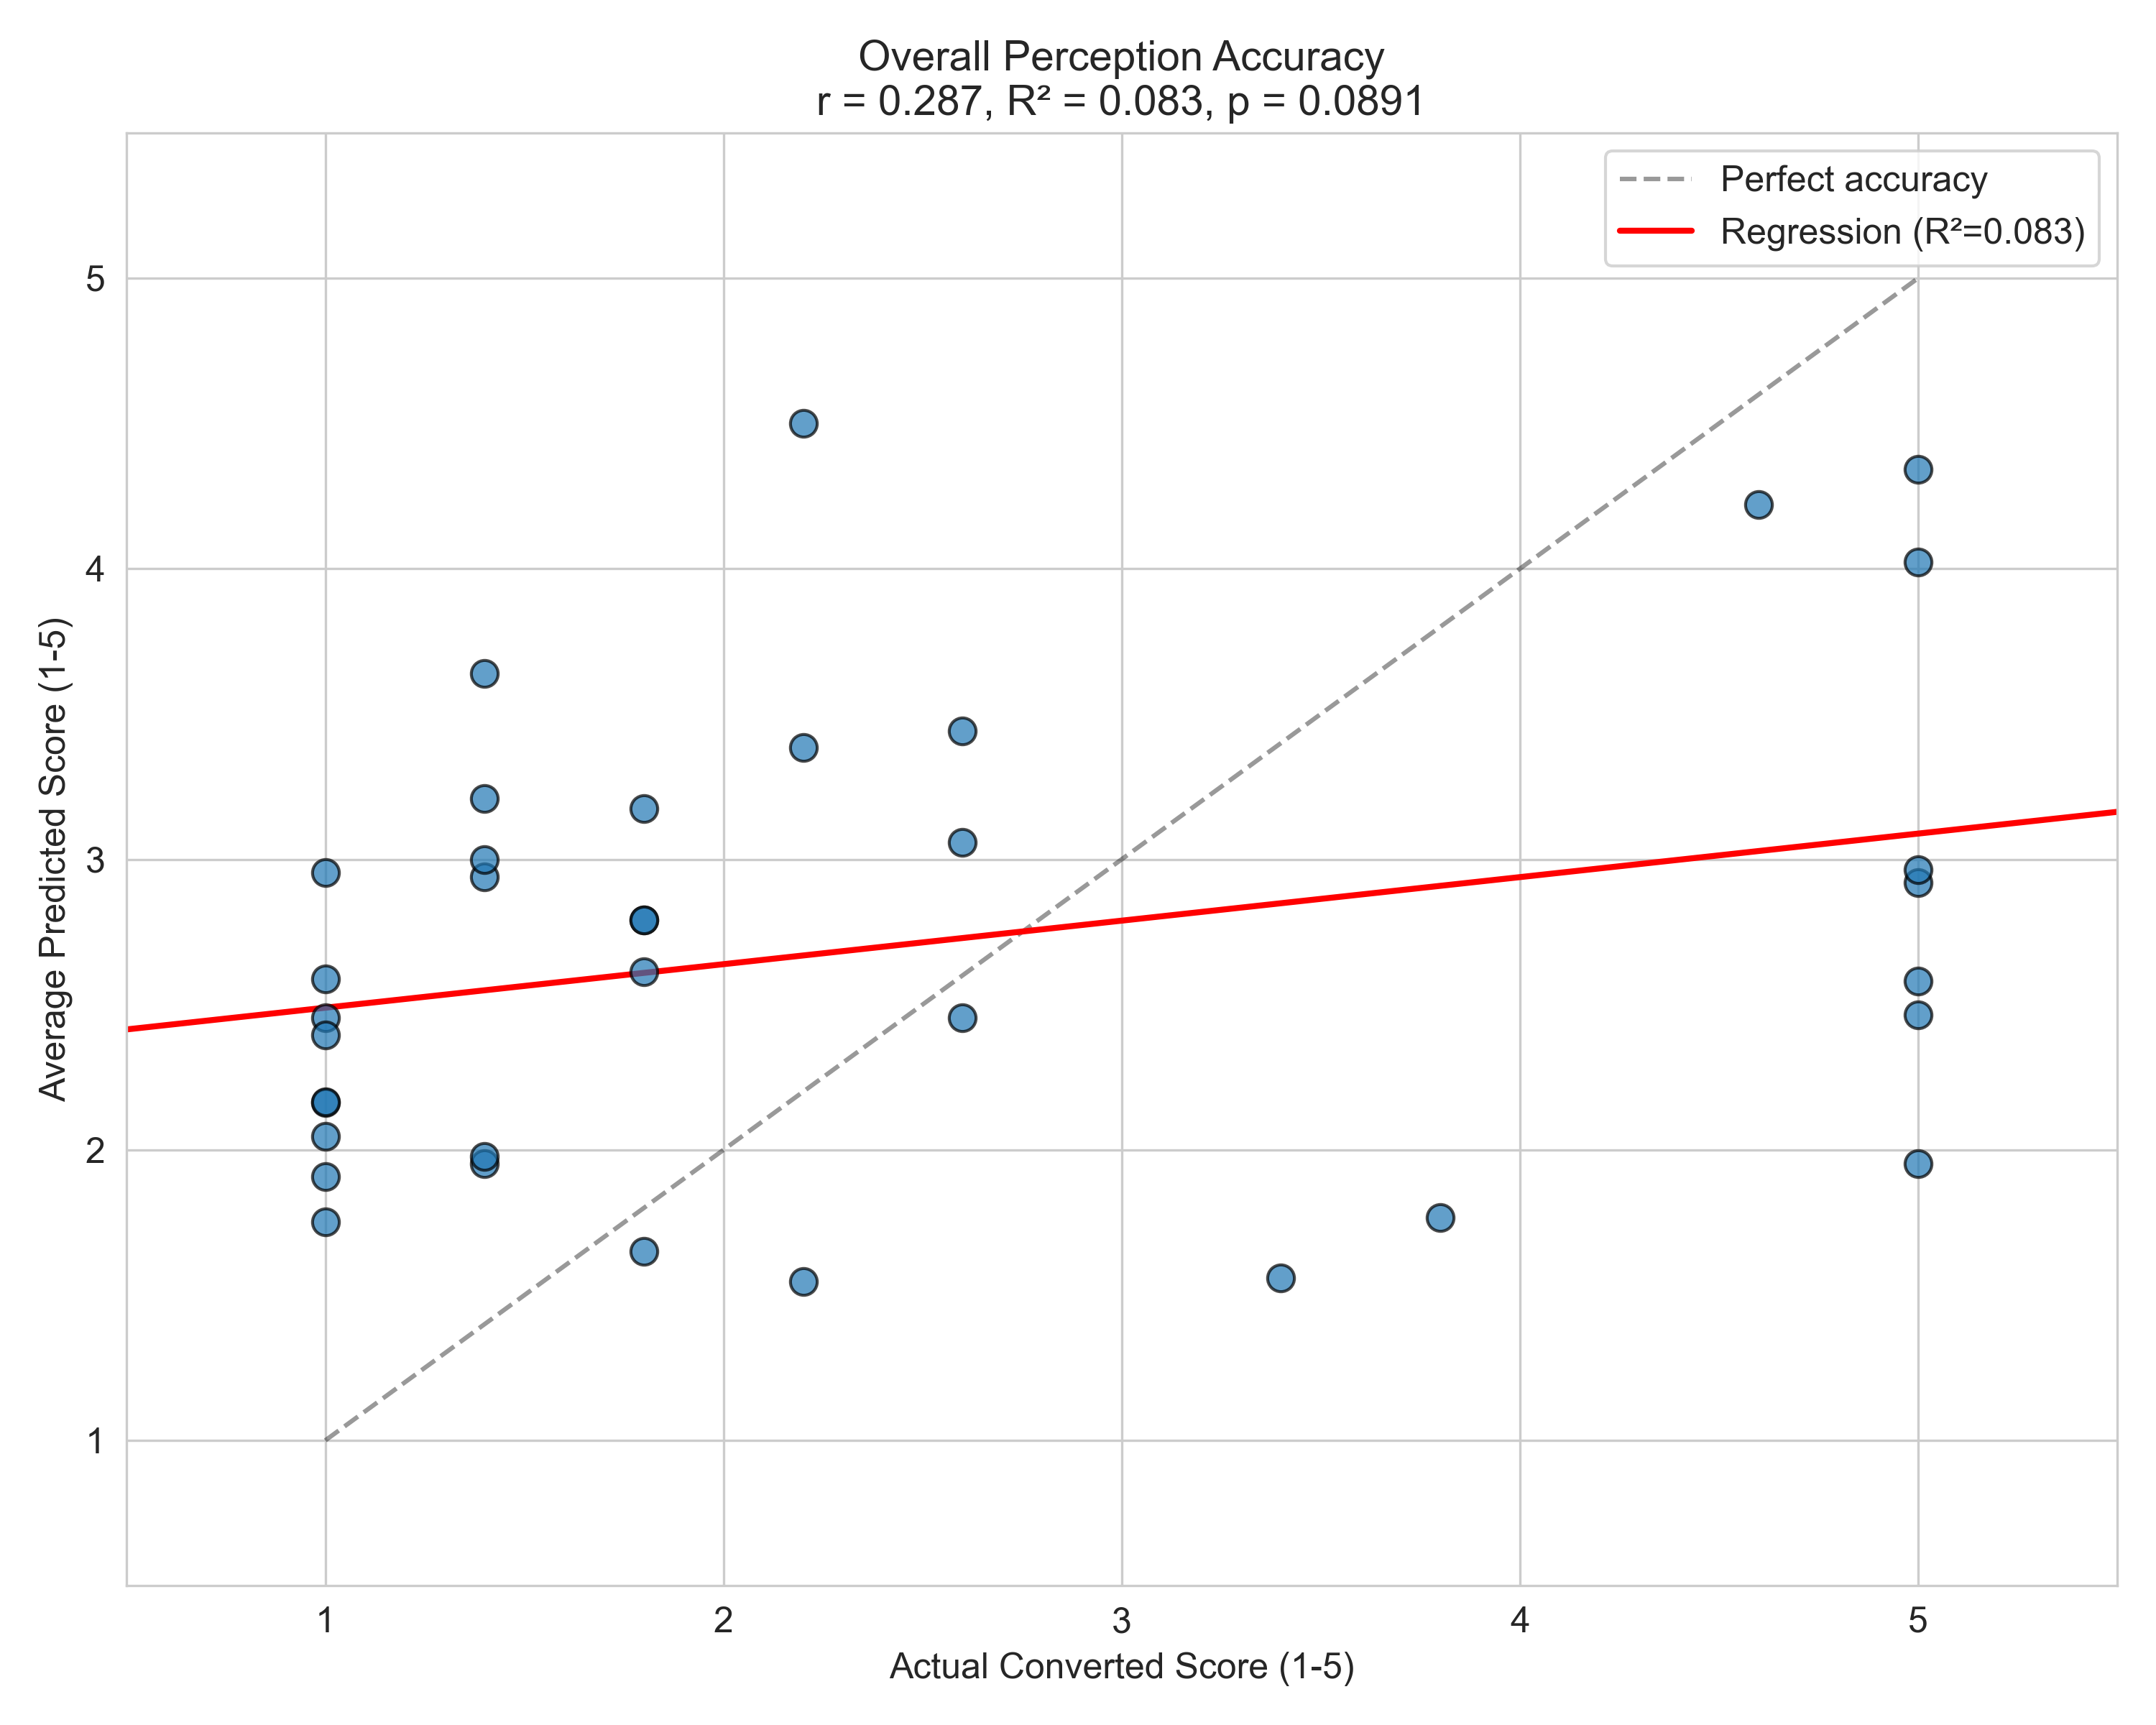
1A — Overall accuracy scatter. r = 0.287, R² = 0.083, p = 0.089.
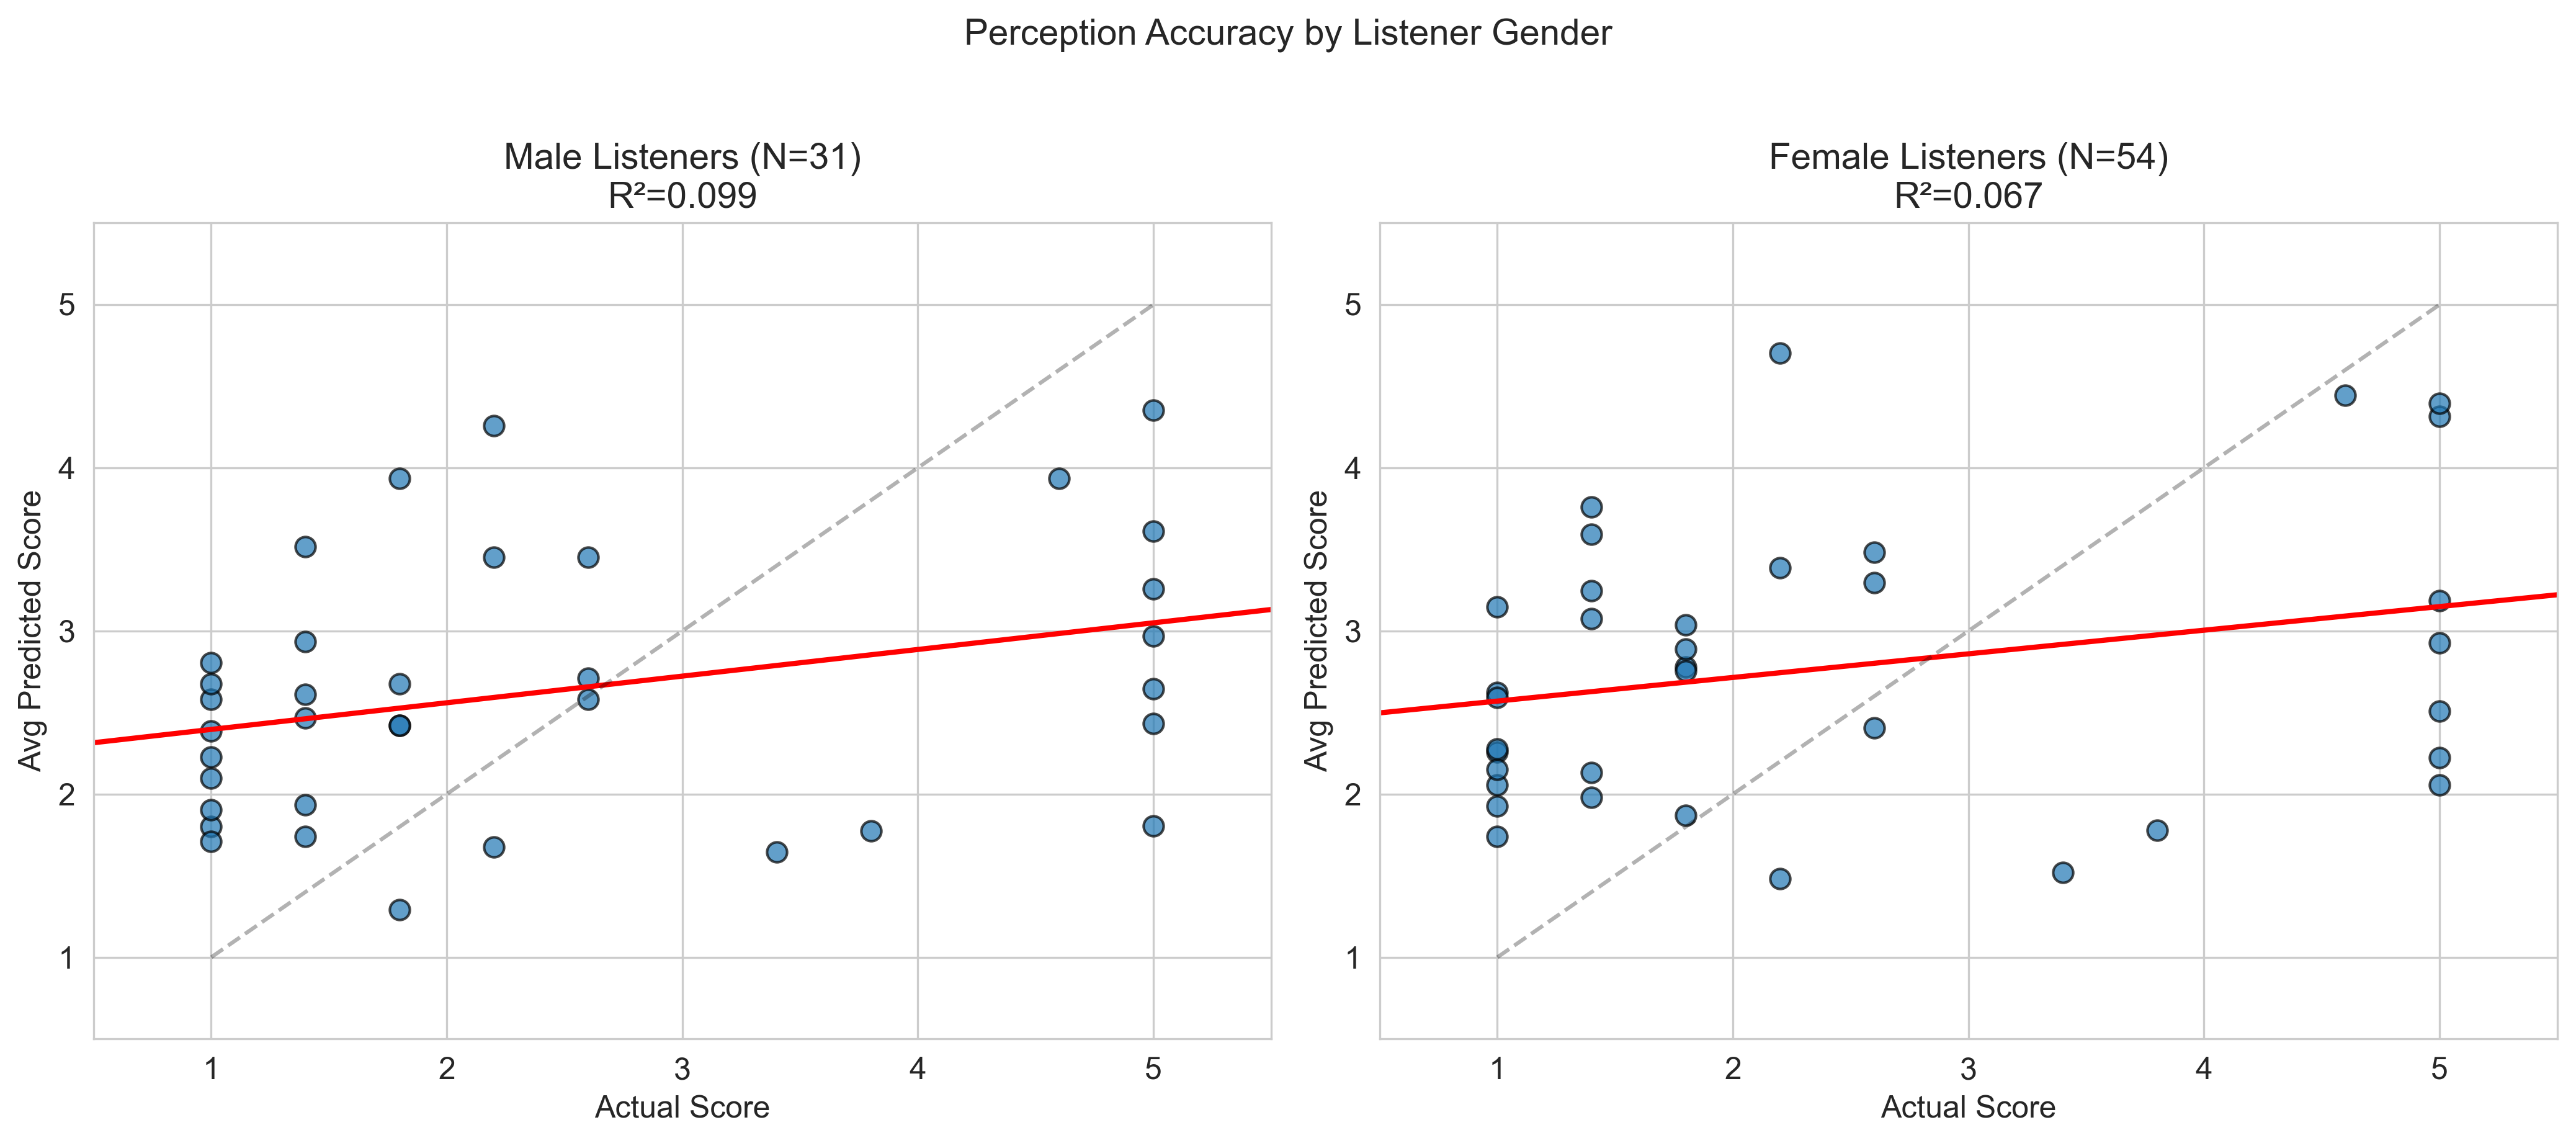
1B — Accuracy broken down by listener gender.
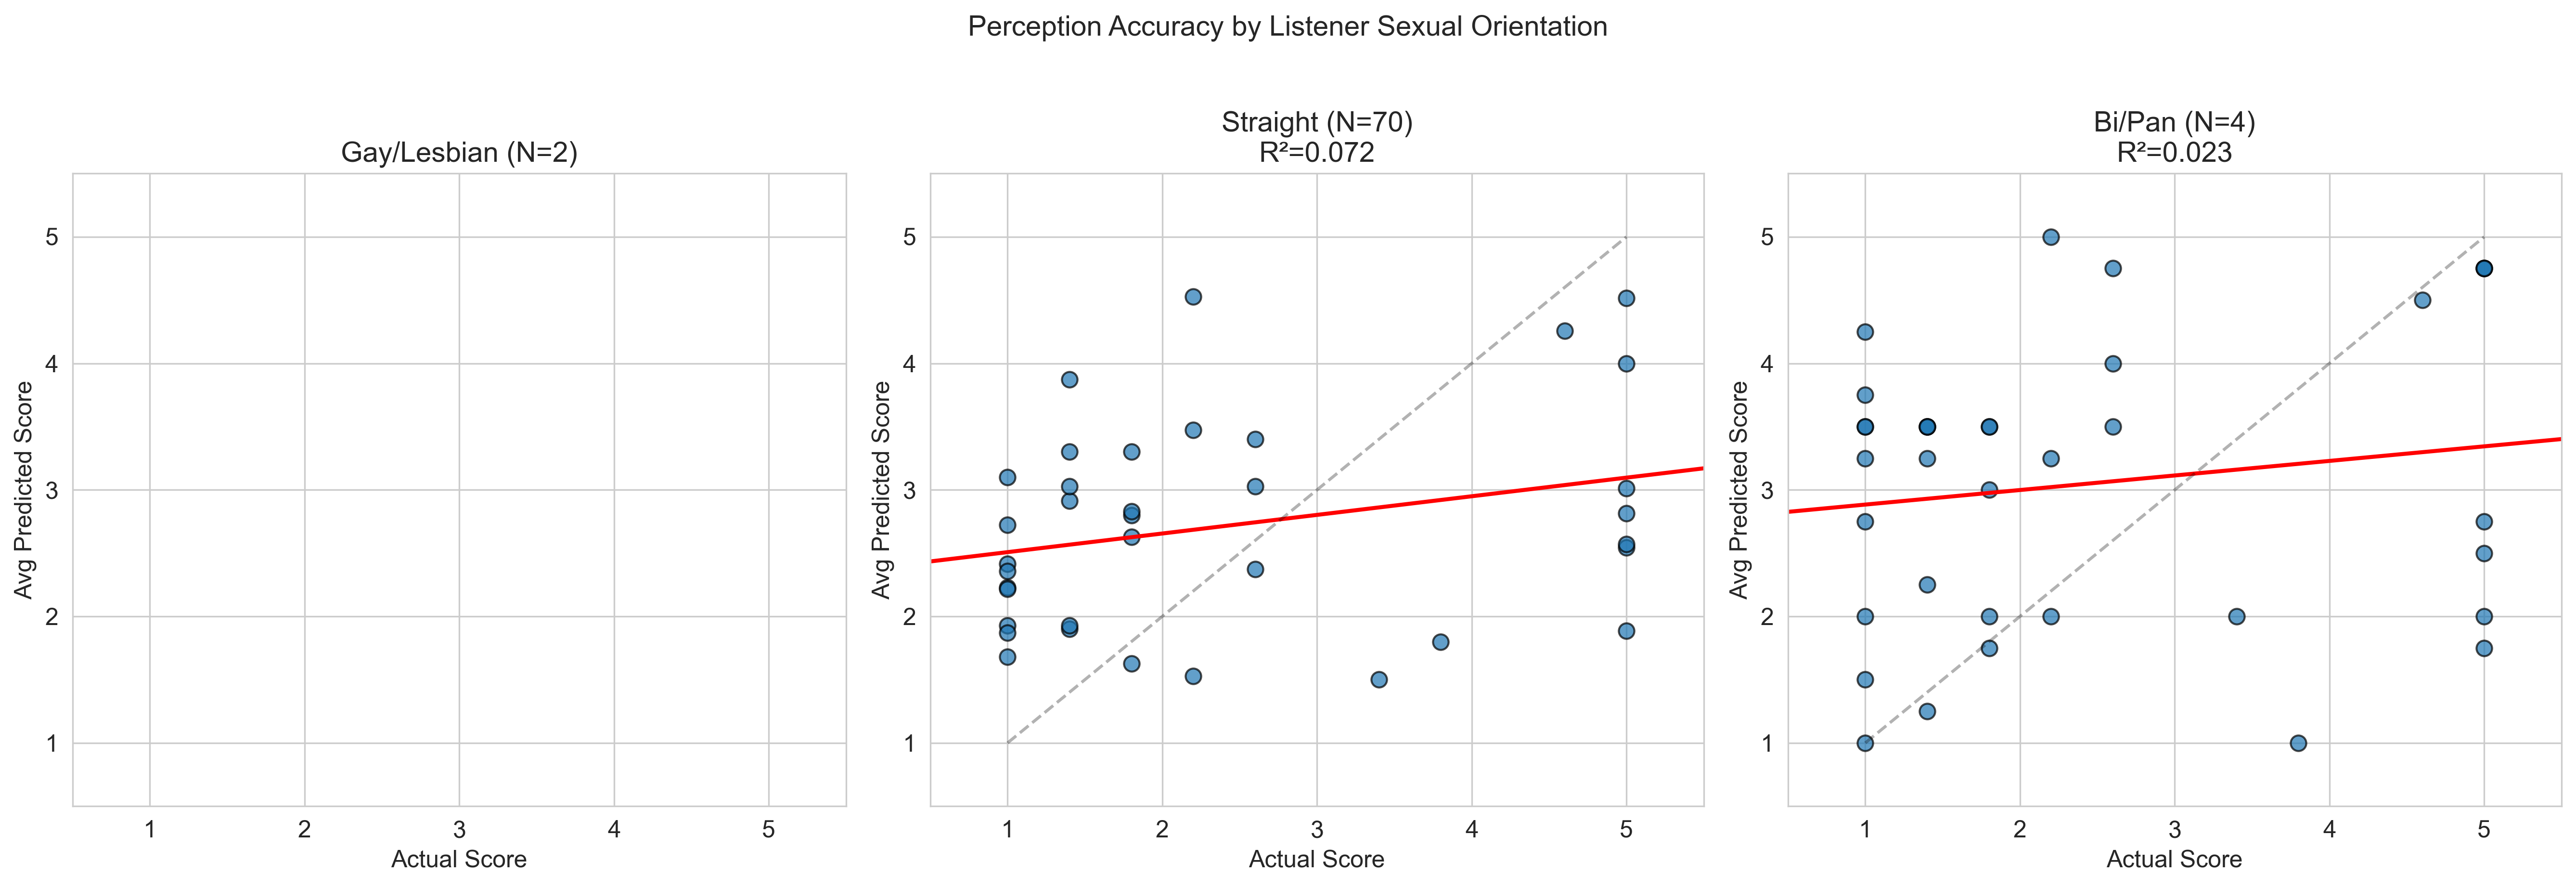
1C — Accuracy broken down by listener sexual orientation.
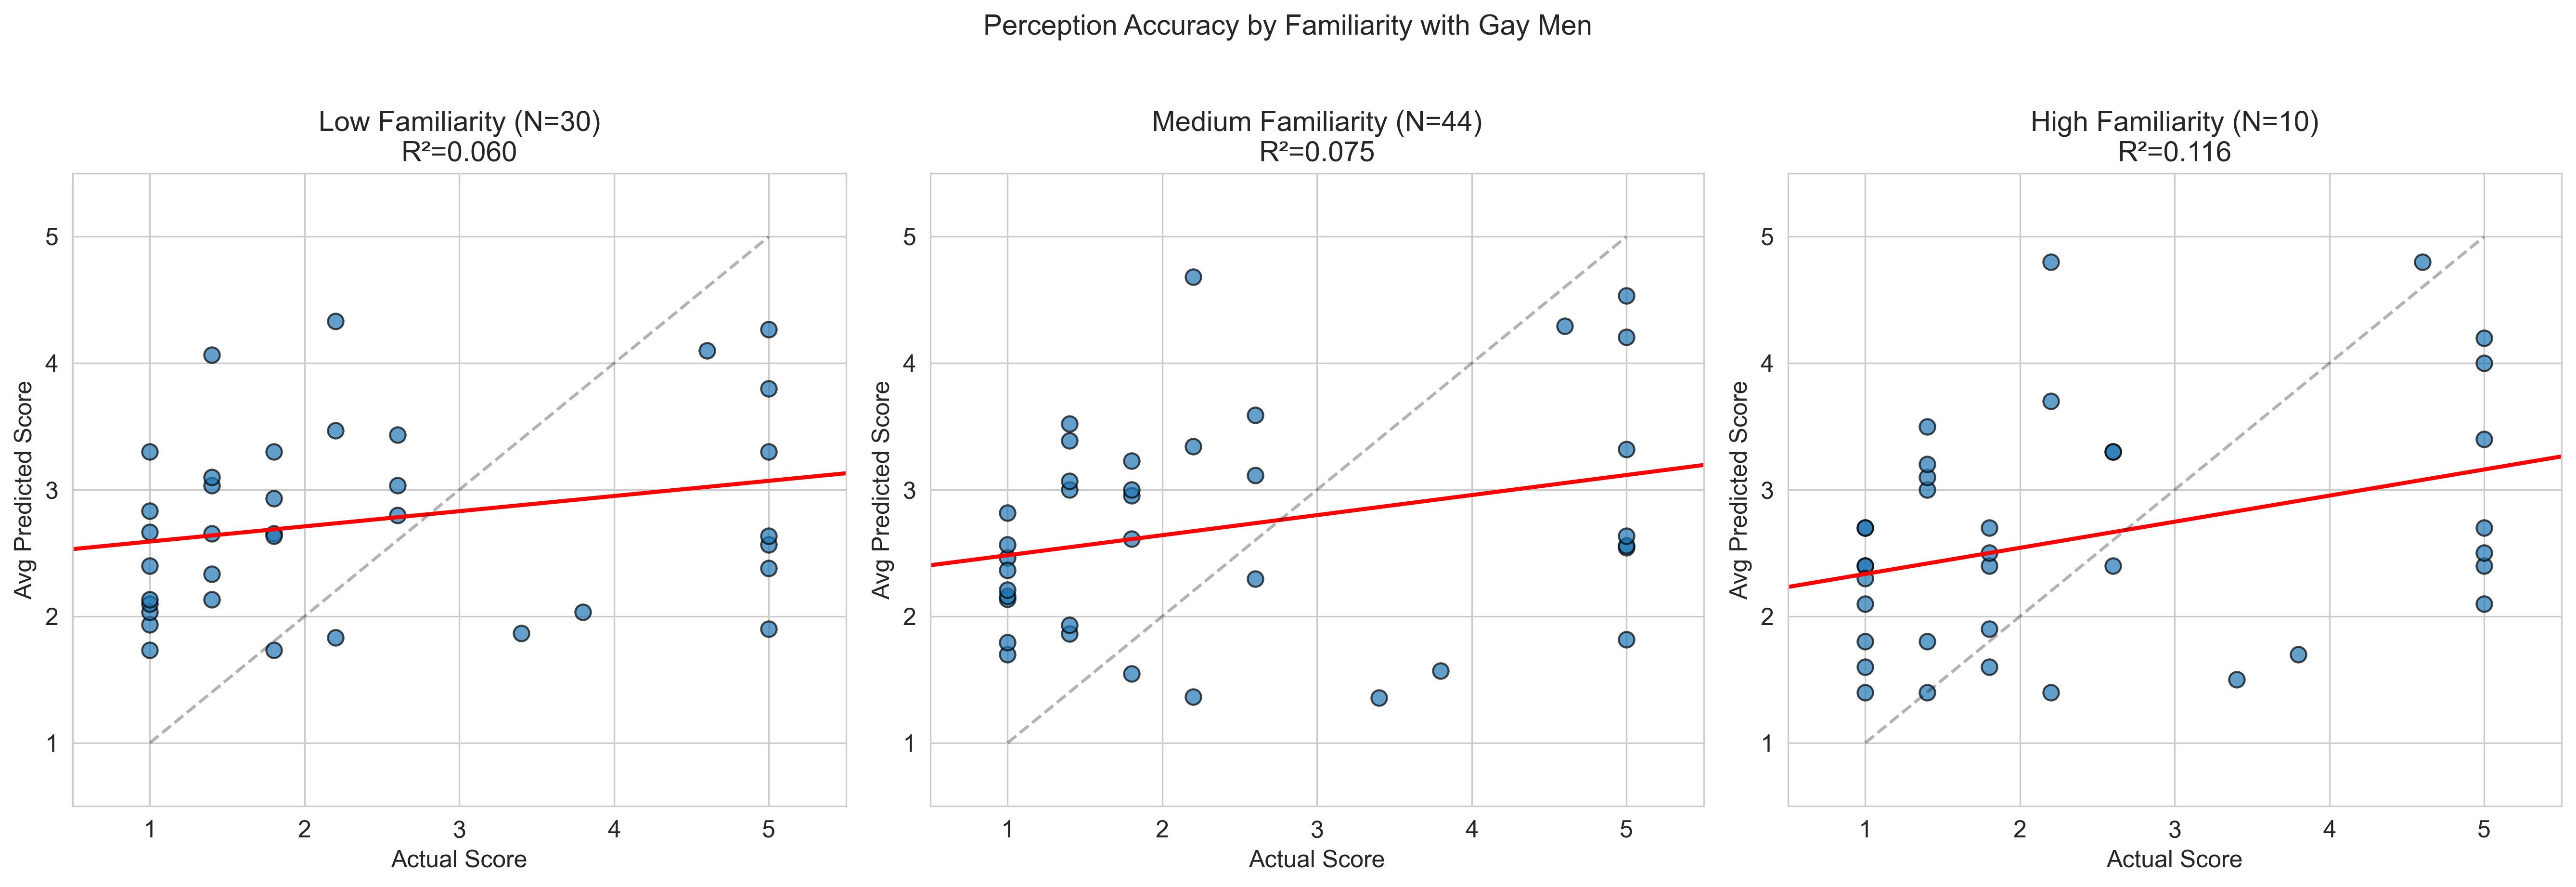
1D — Accuracy broken down by listener familiarity with gay individuals.
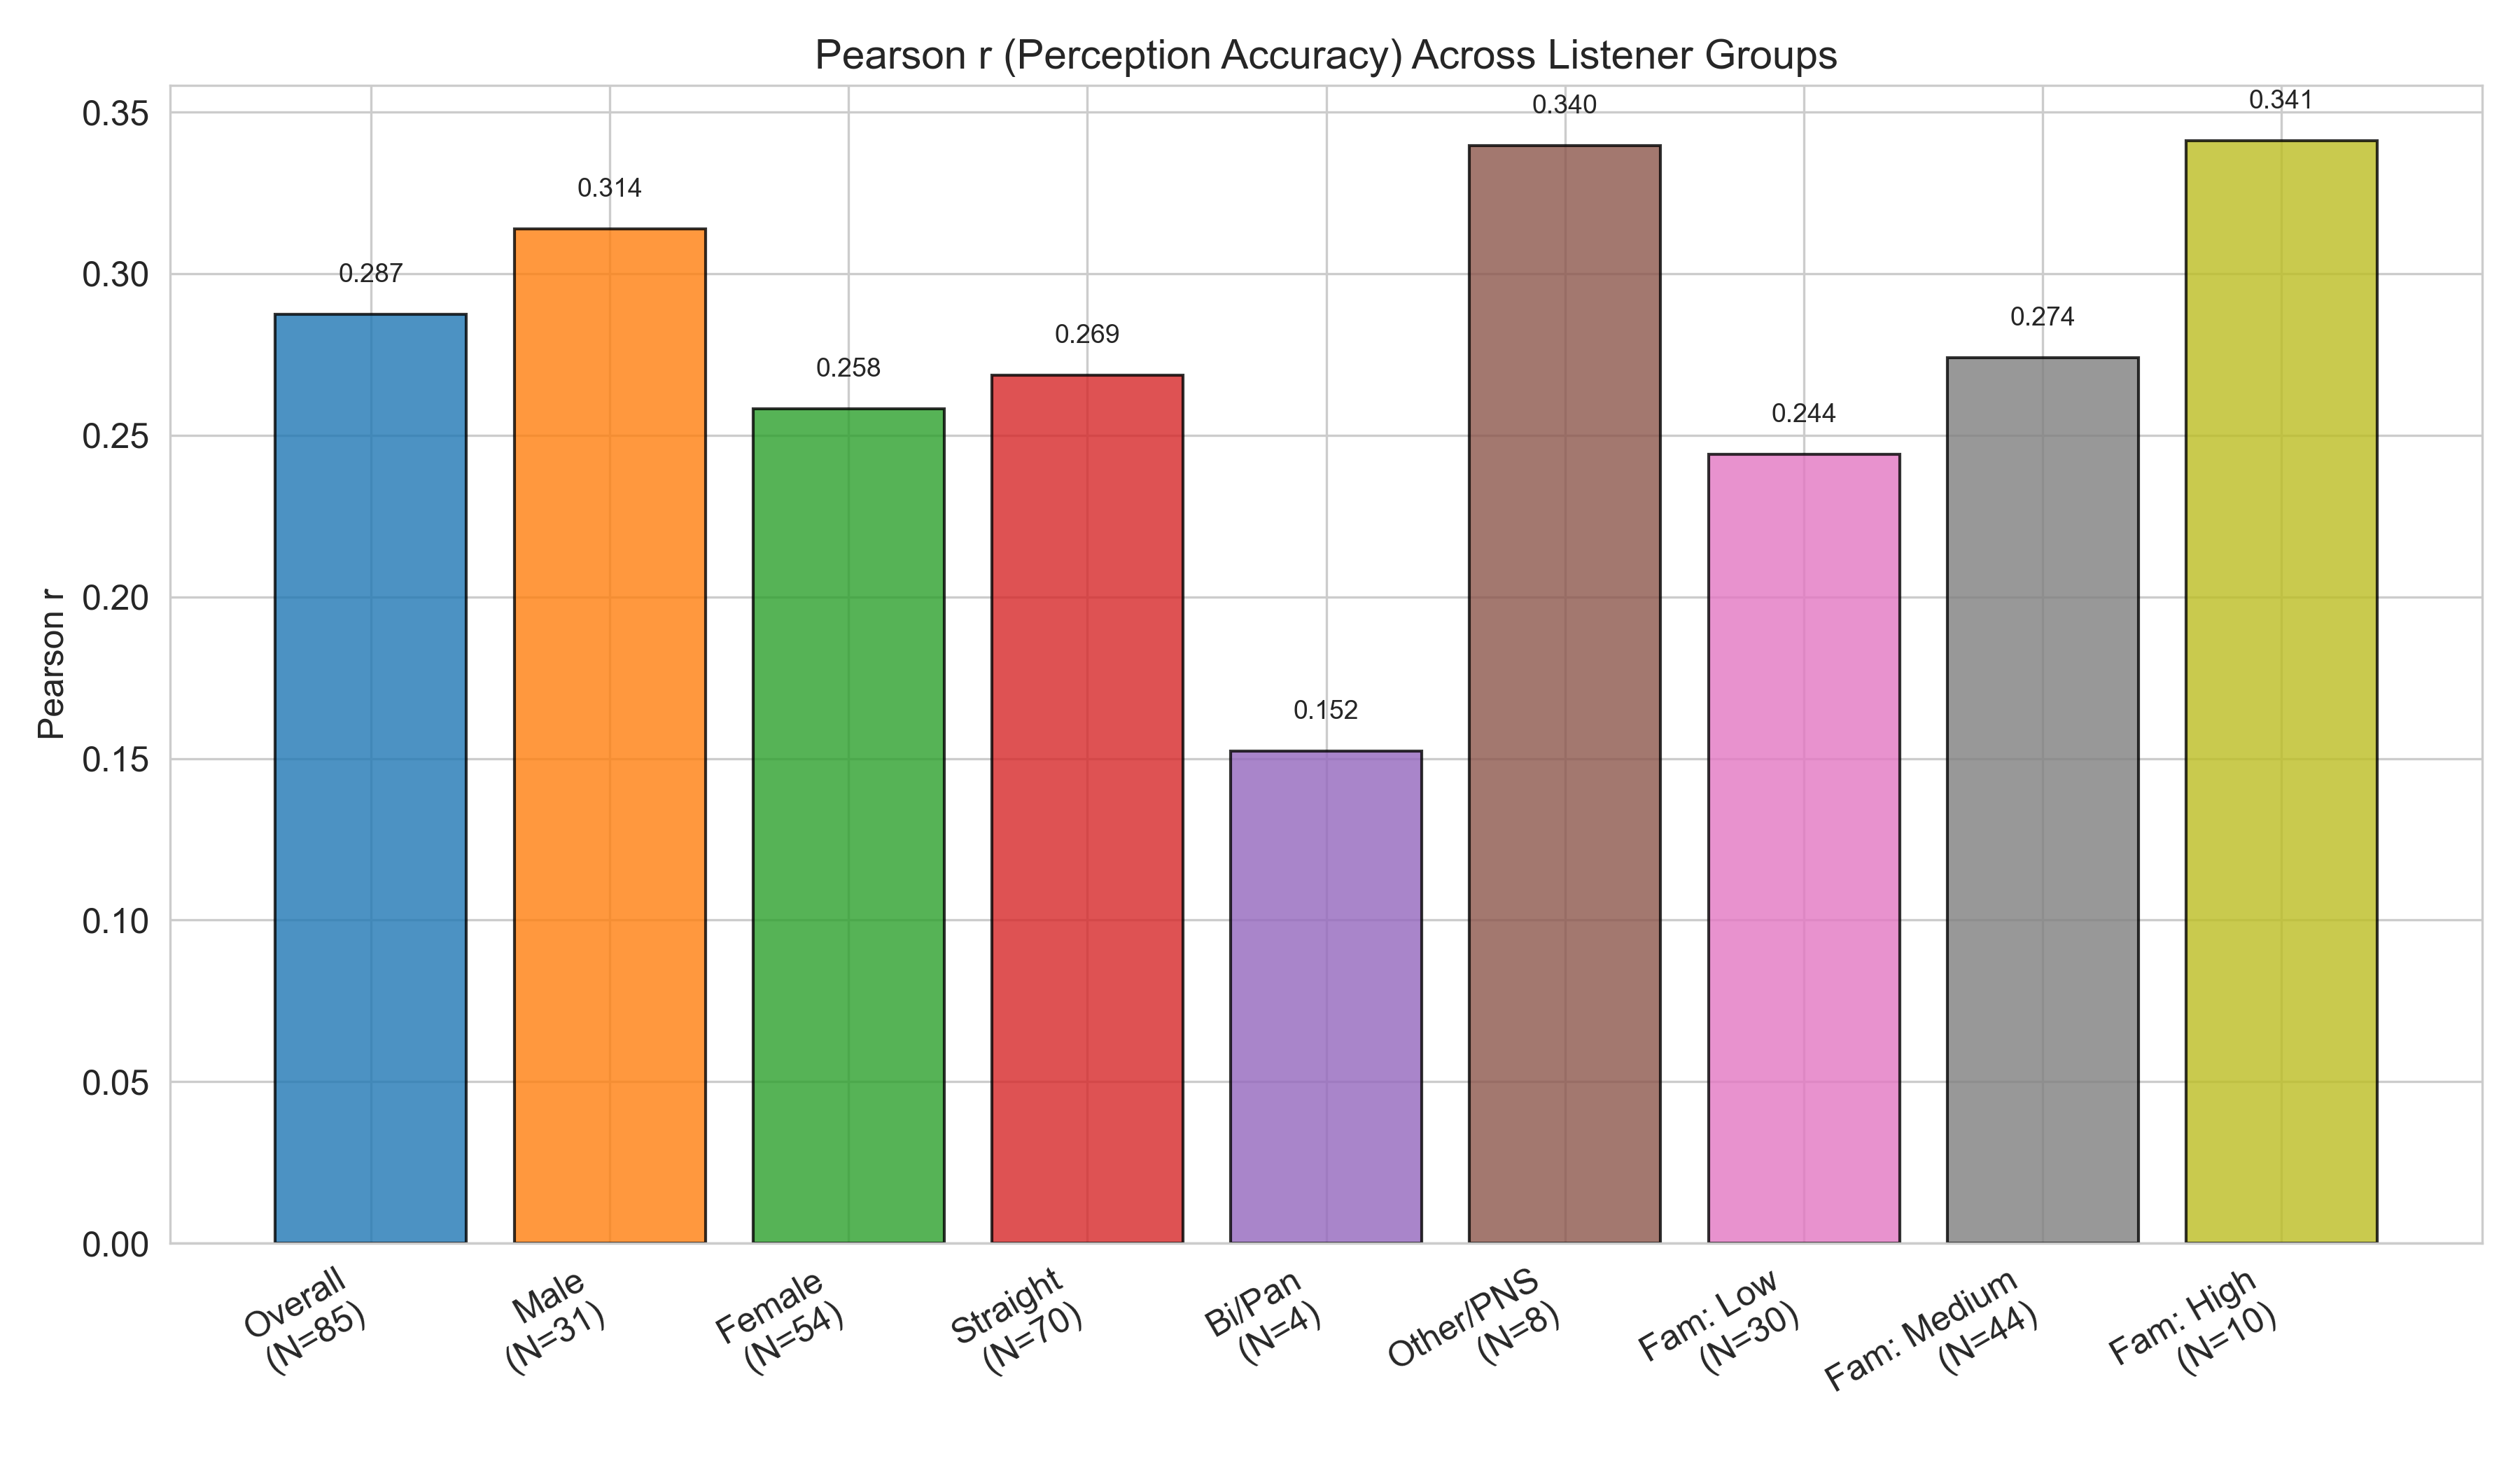
1E — Correlation comparison barplot across demographic groups.
Section 2: Individual Listener Accuracy
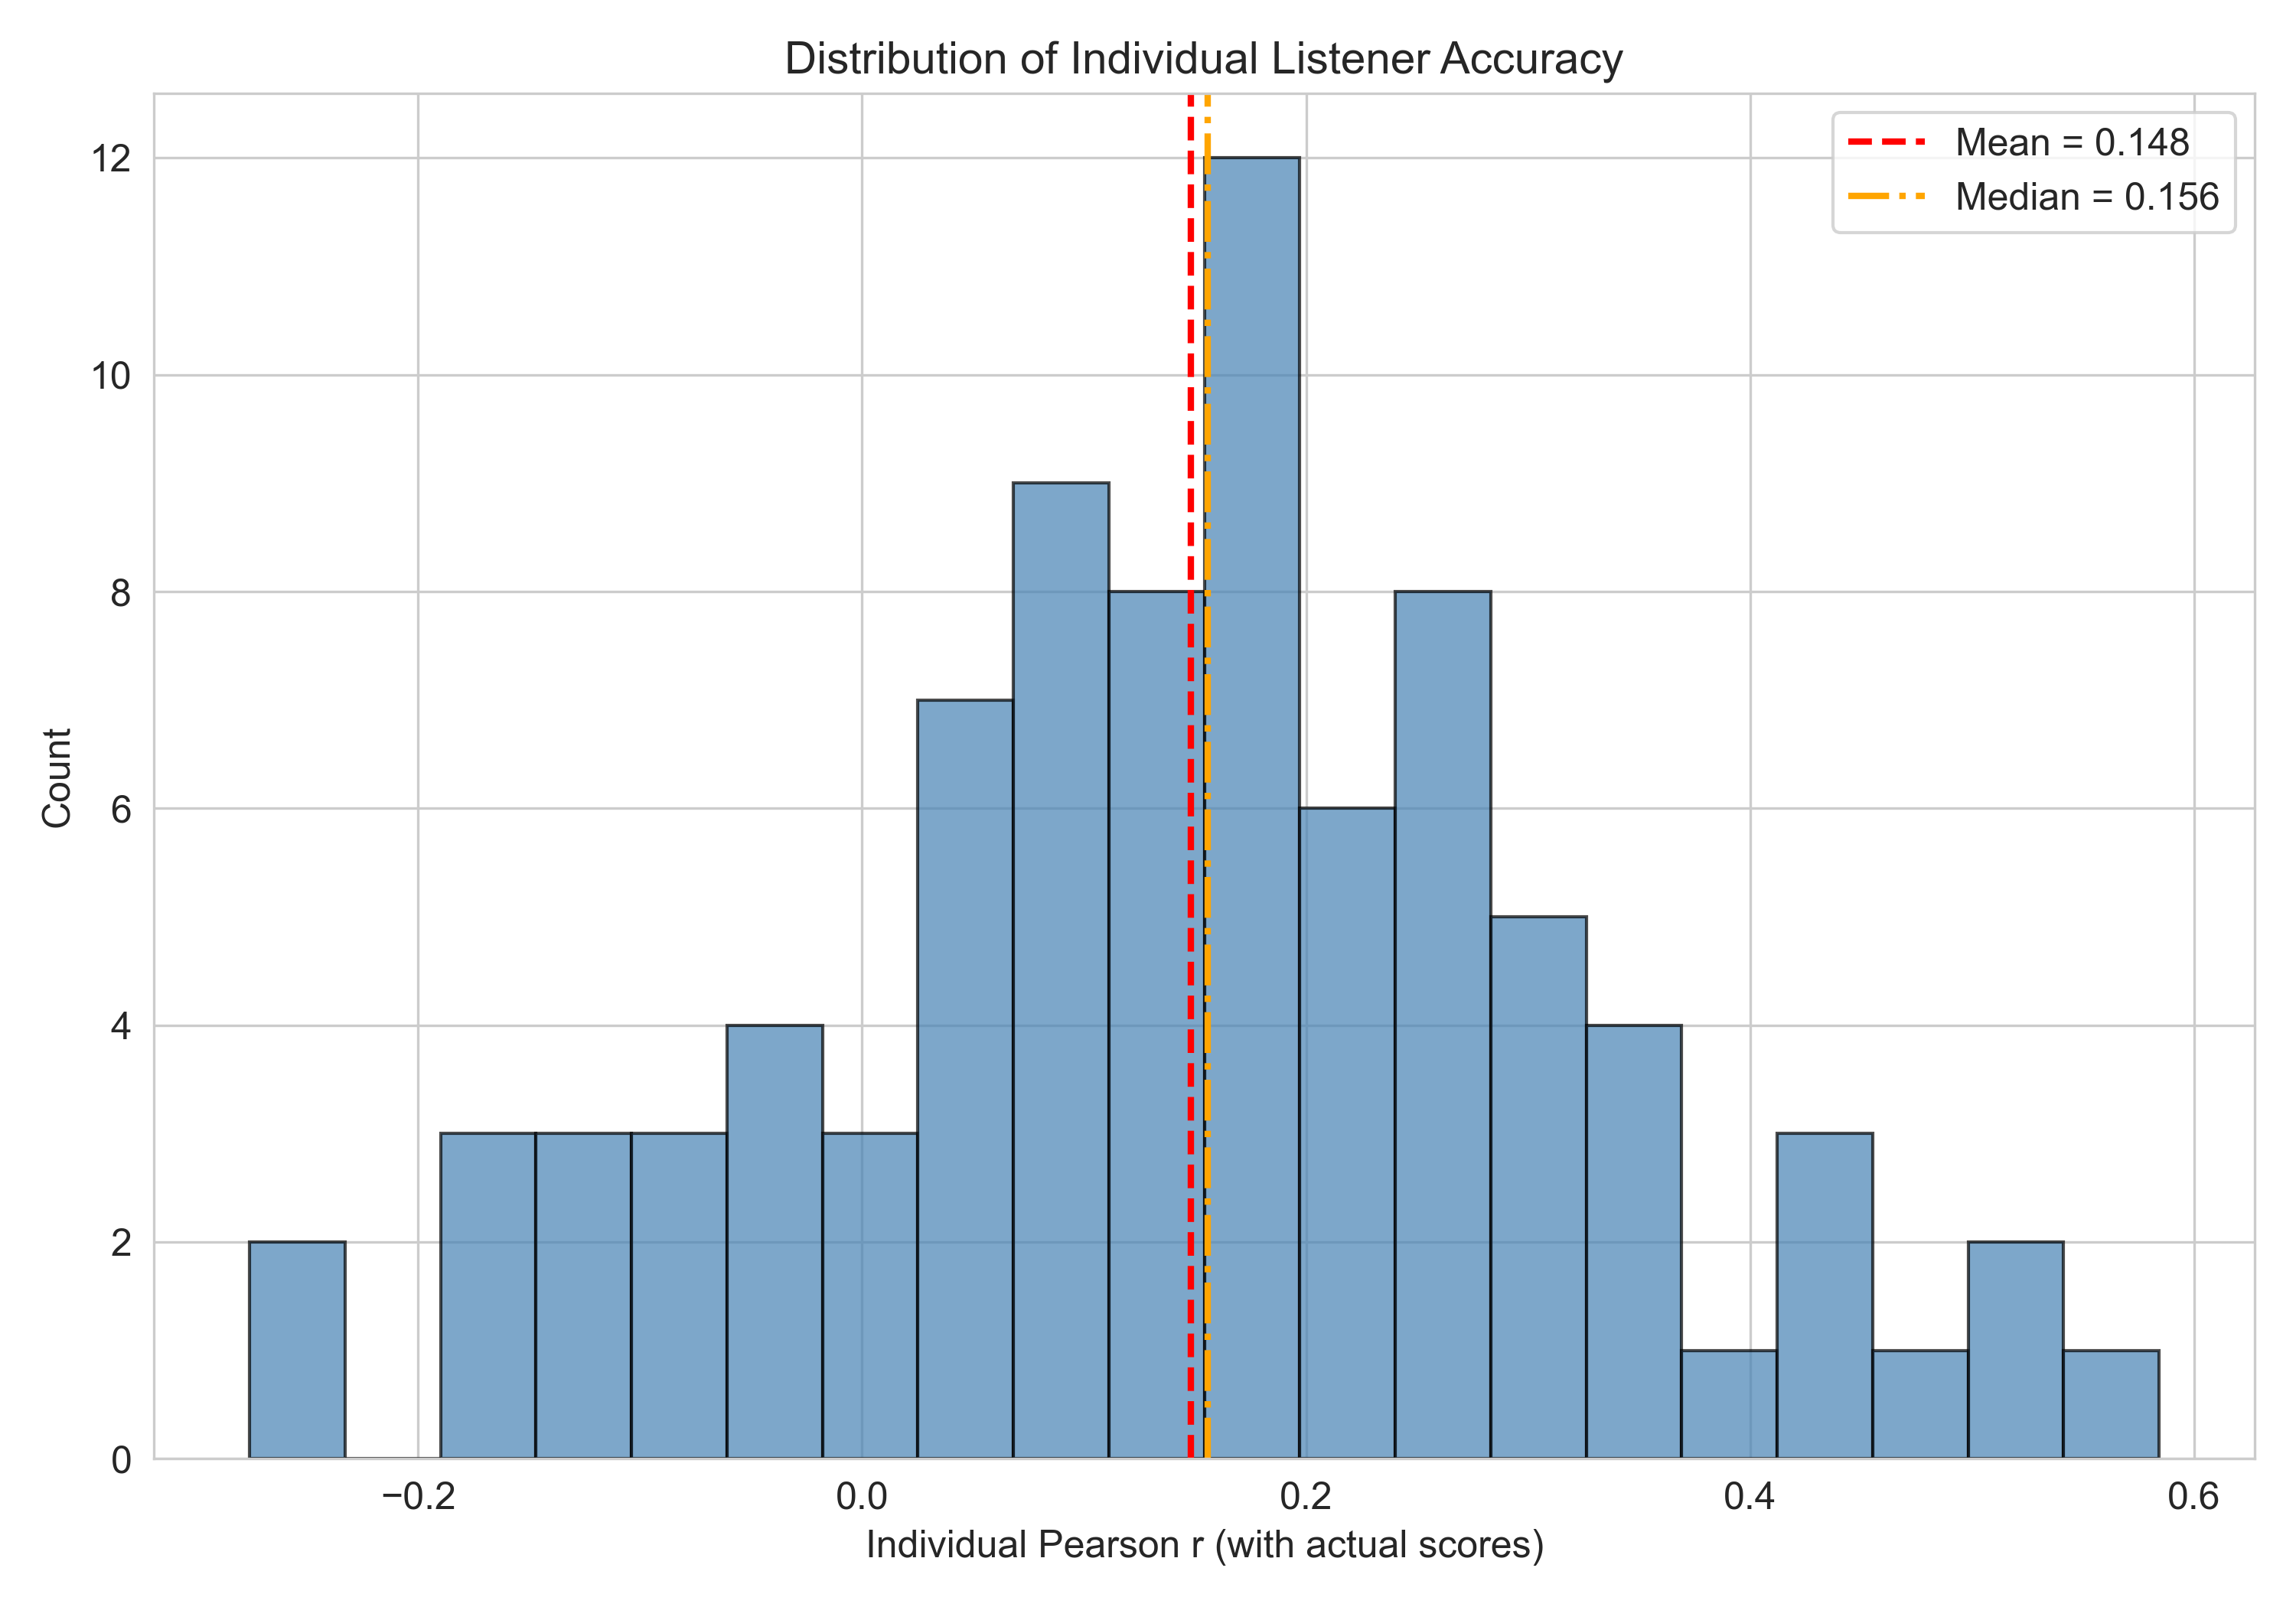
2A — Distribution of per-listener accuracy scores.
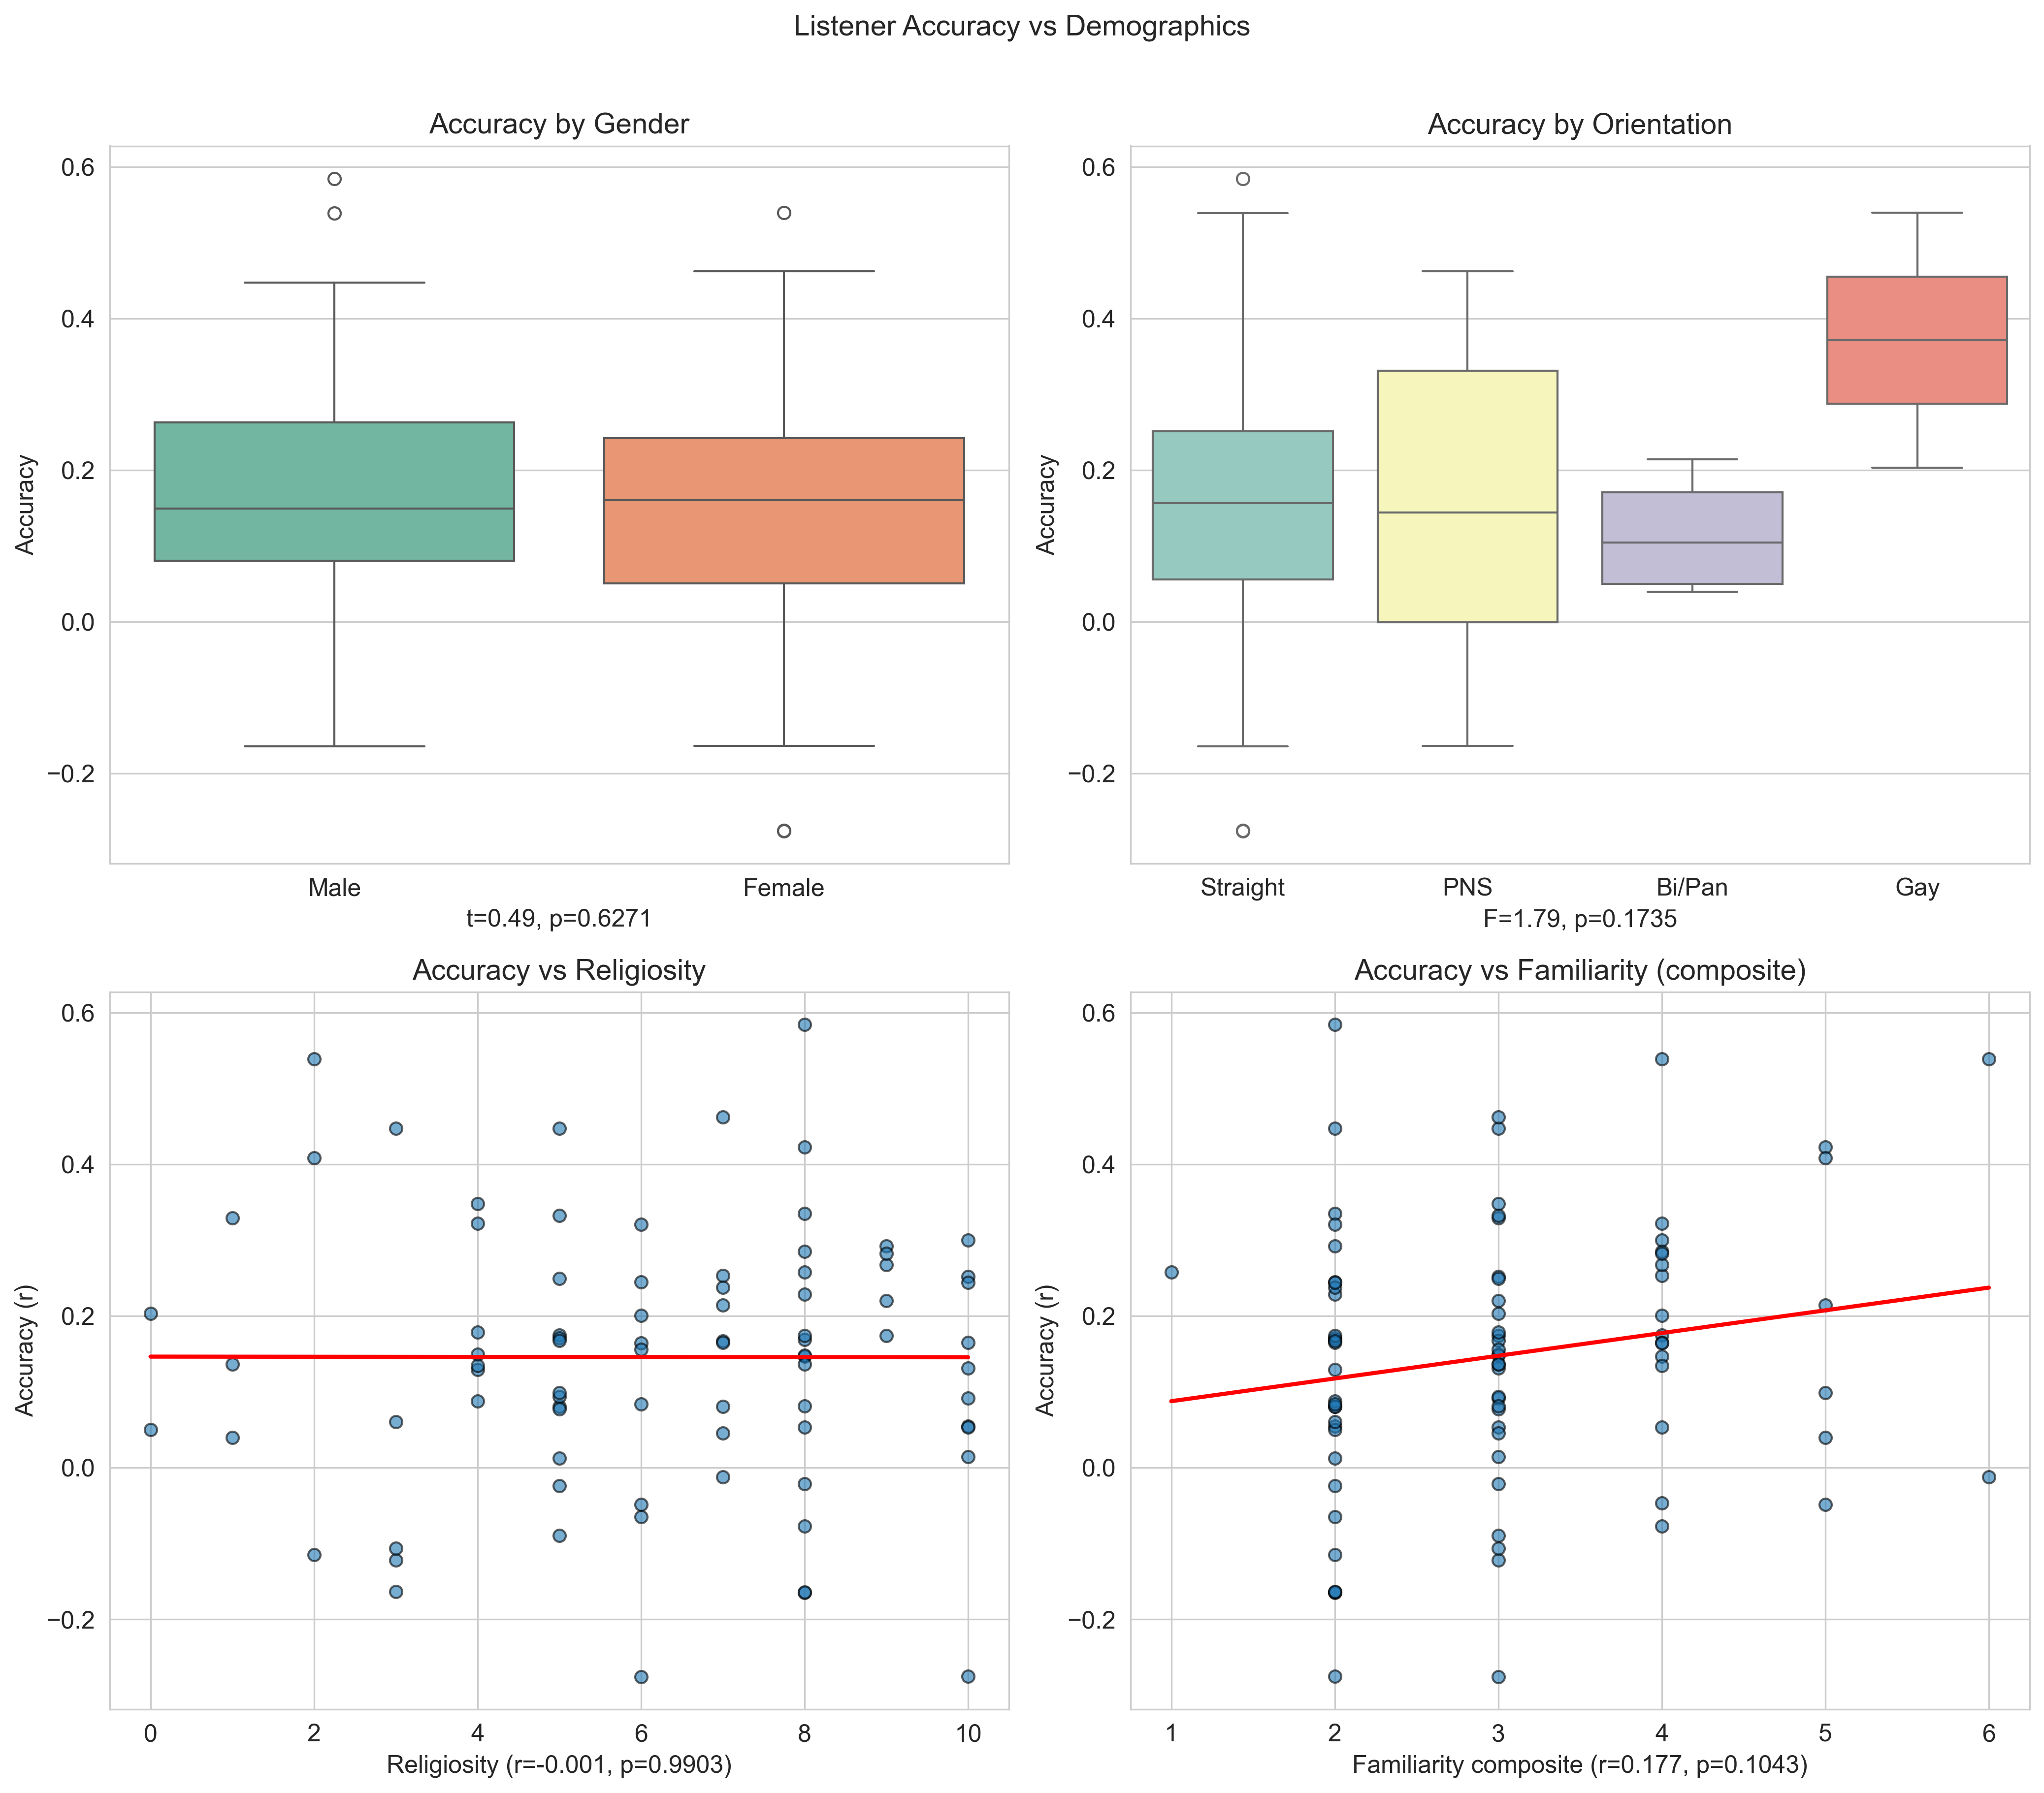
2B — Listener accuracy vs. self-reported characteristics.
Section 3: Inter-Rater Reliability
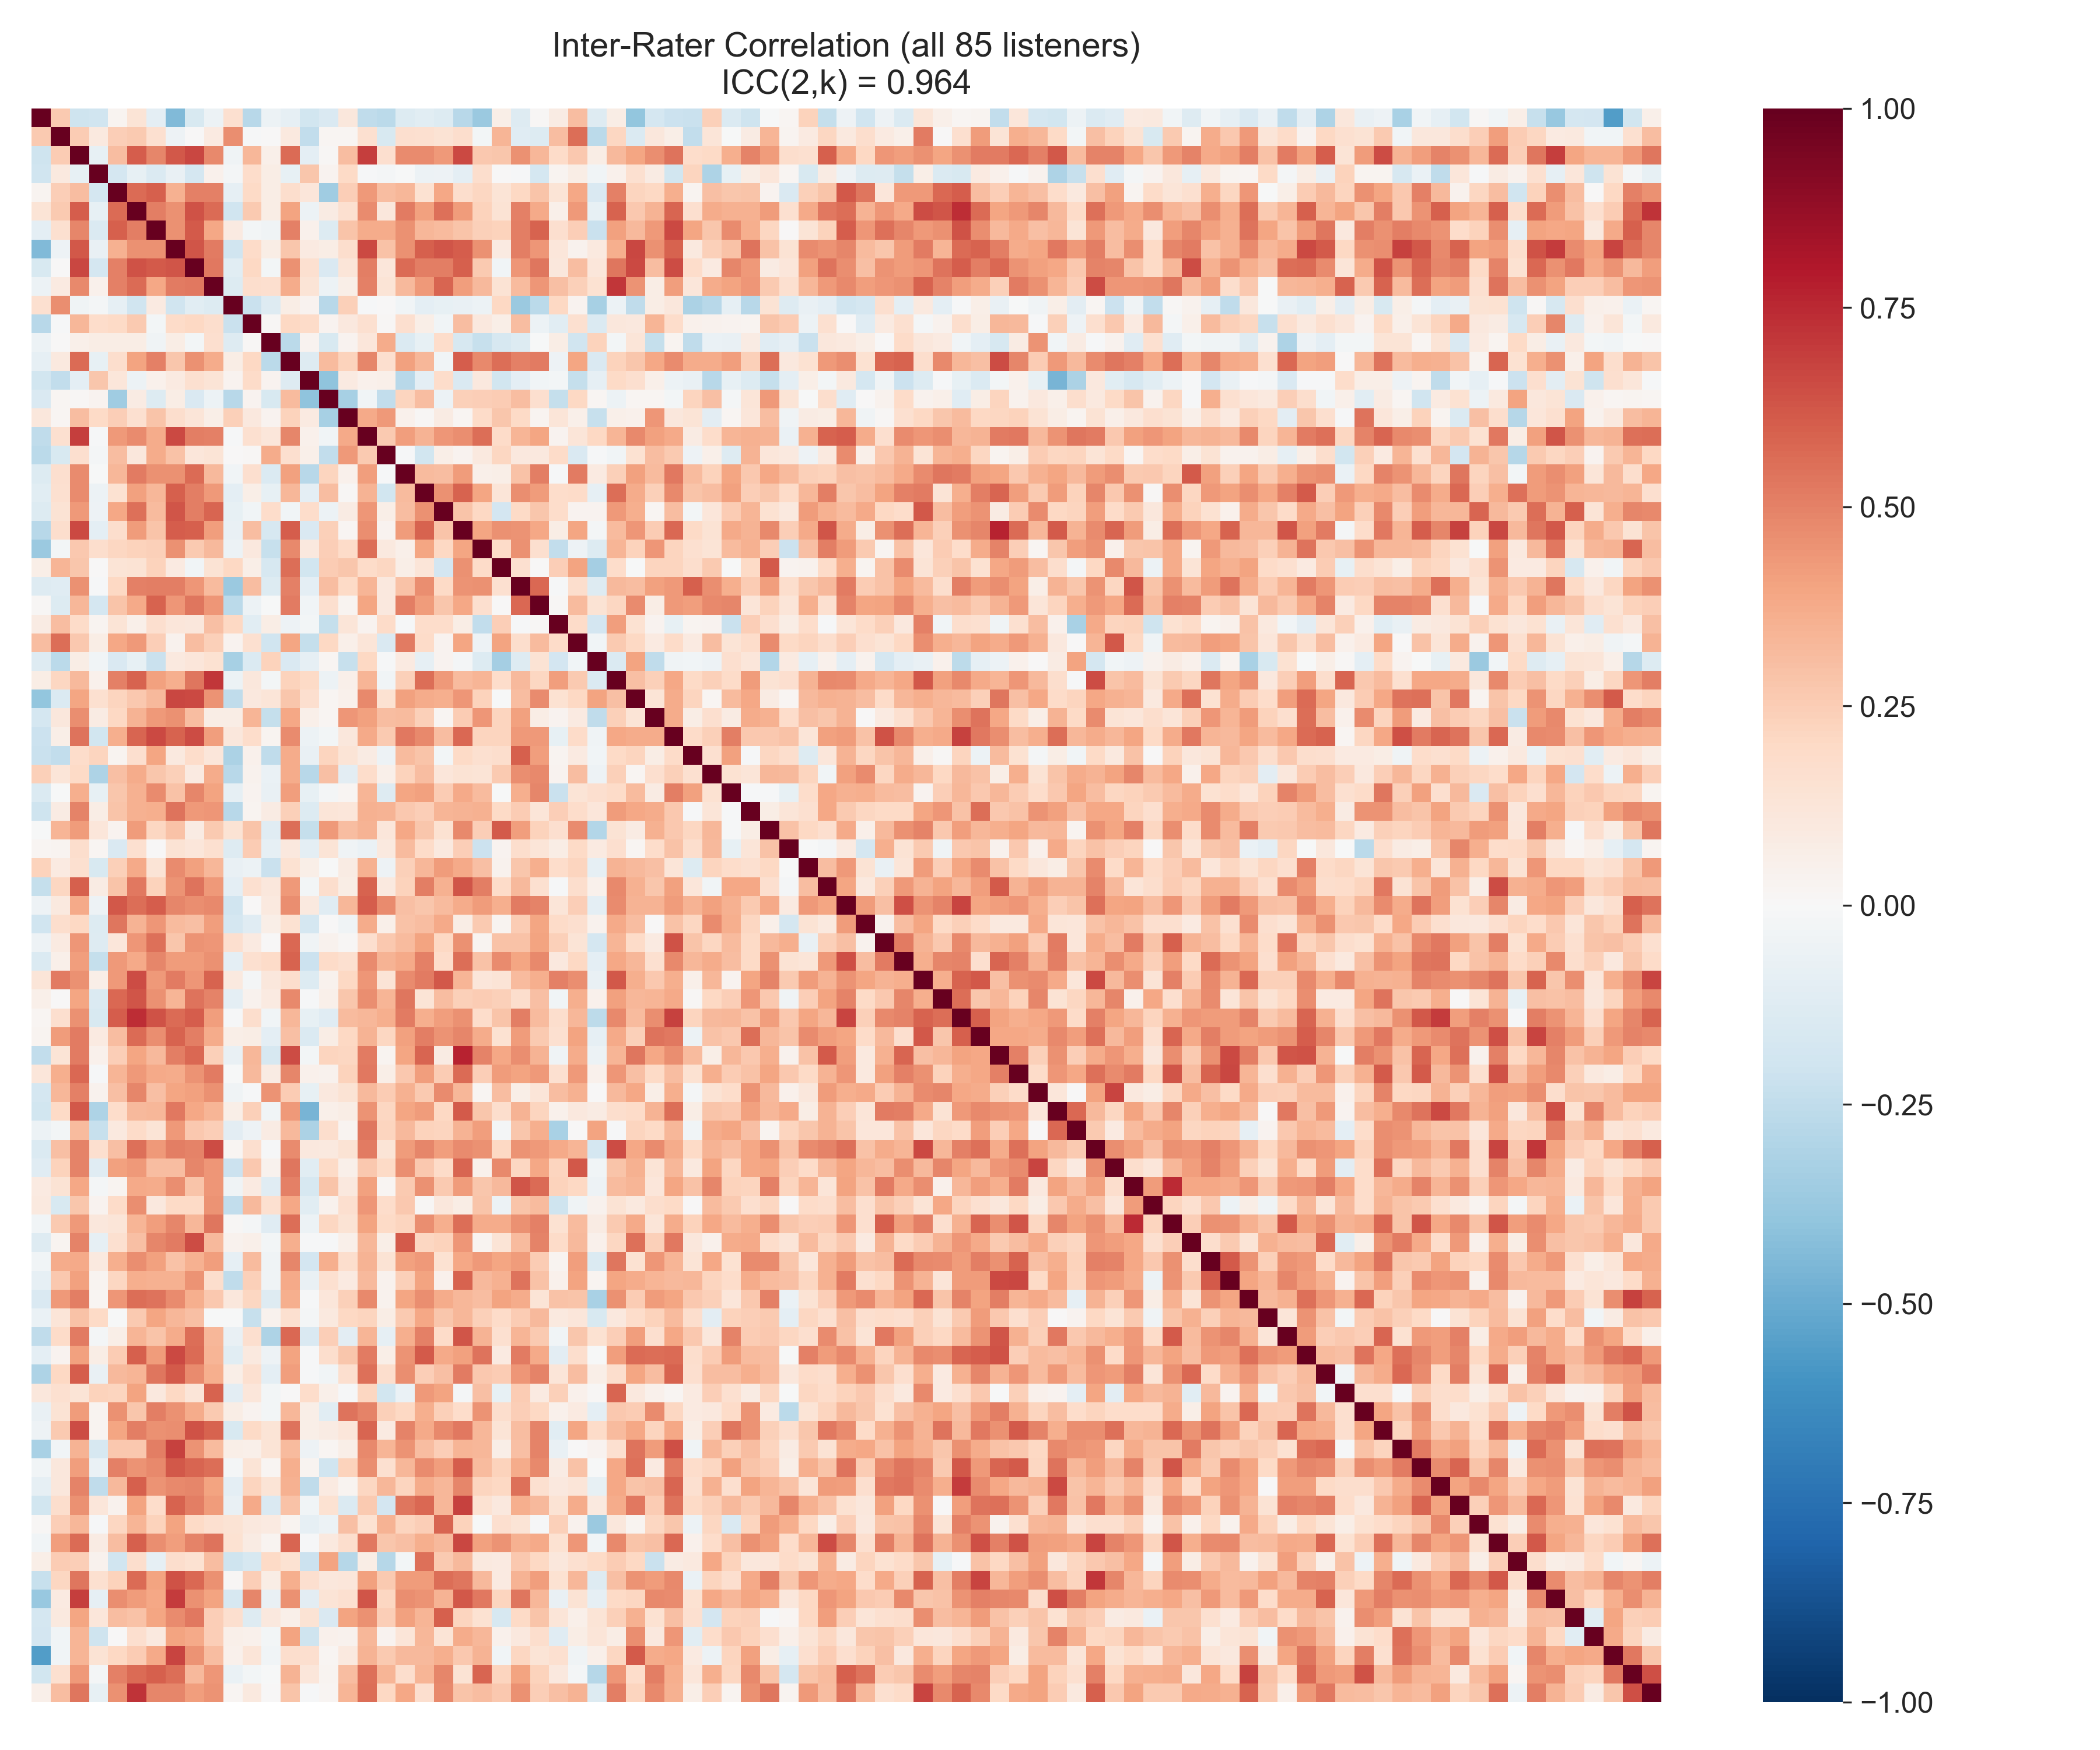
3A — Inter-rater correlation matrix across all 85 listeners. ICC(2,k) = 0.964.
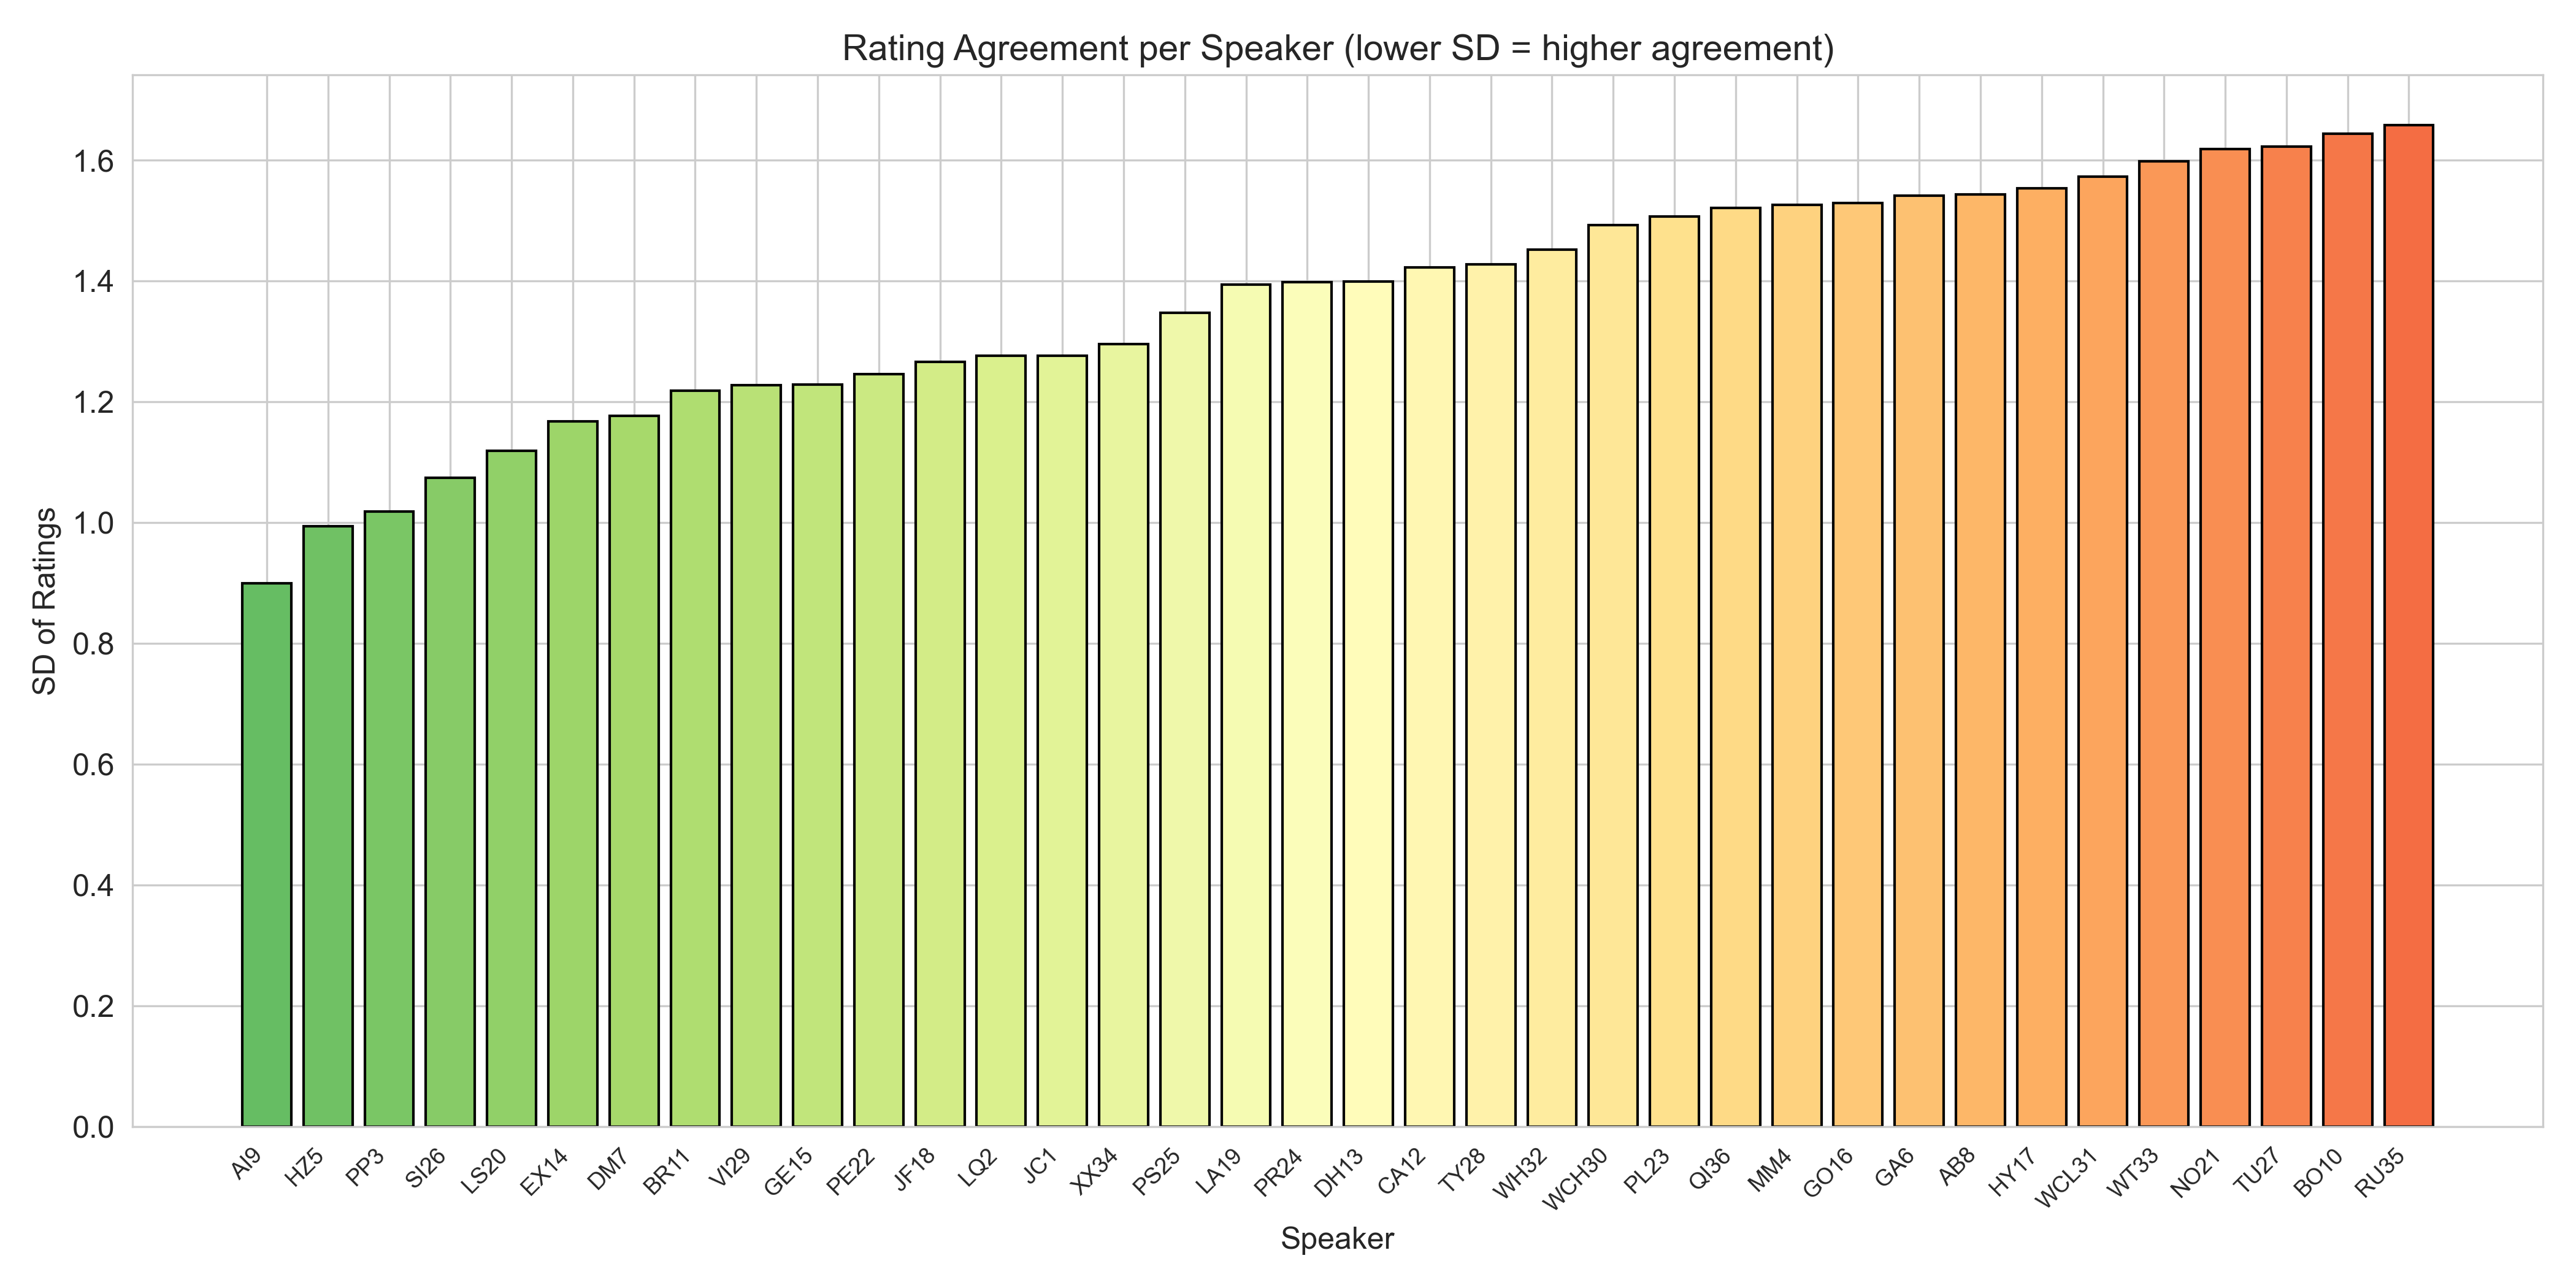
3B — Distribution of listener agreement by speaker.
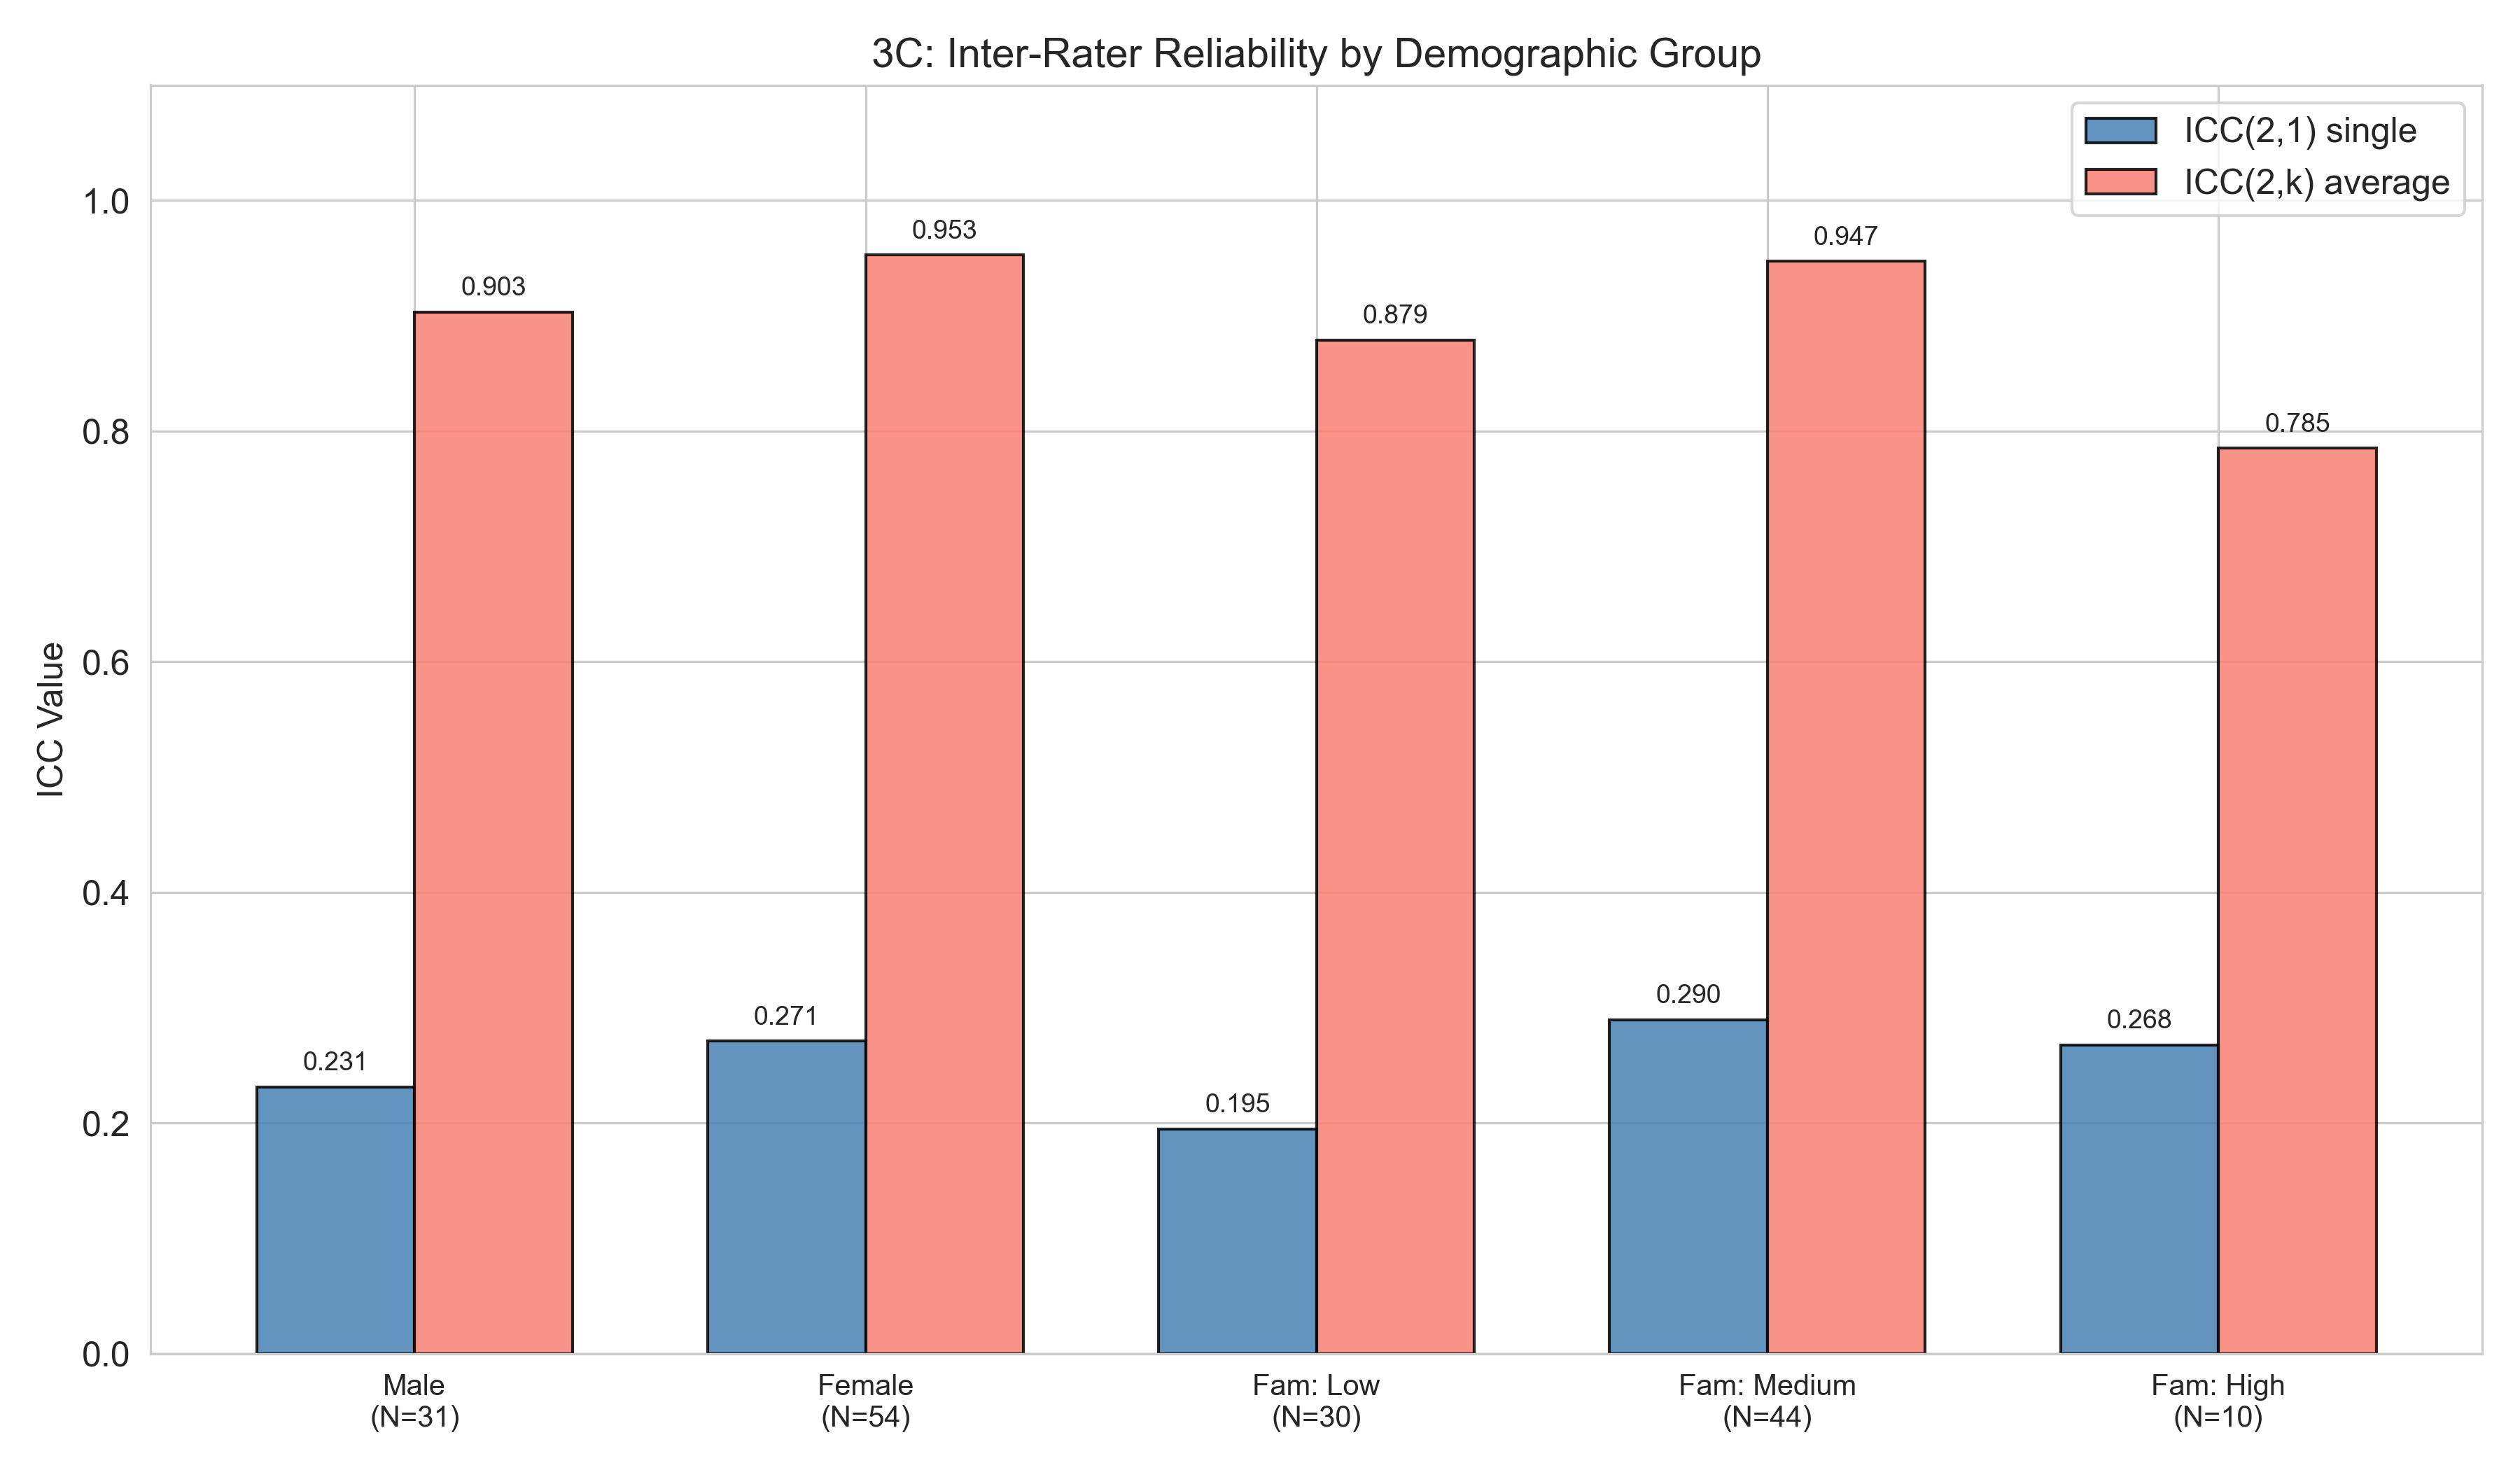
3C — ICC broken down by listener demographics.
Section 4: Consensus vs. Accuracy
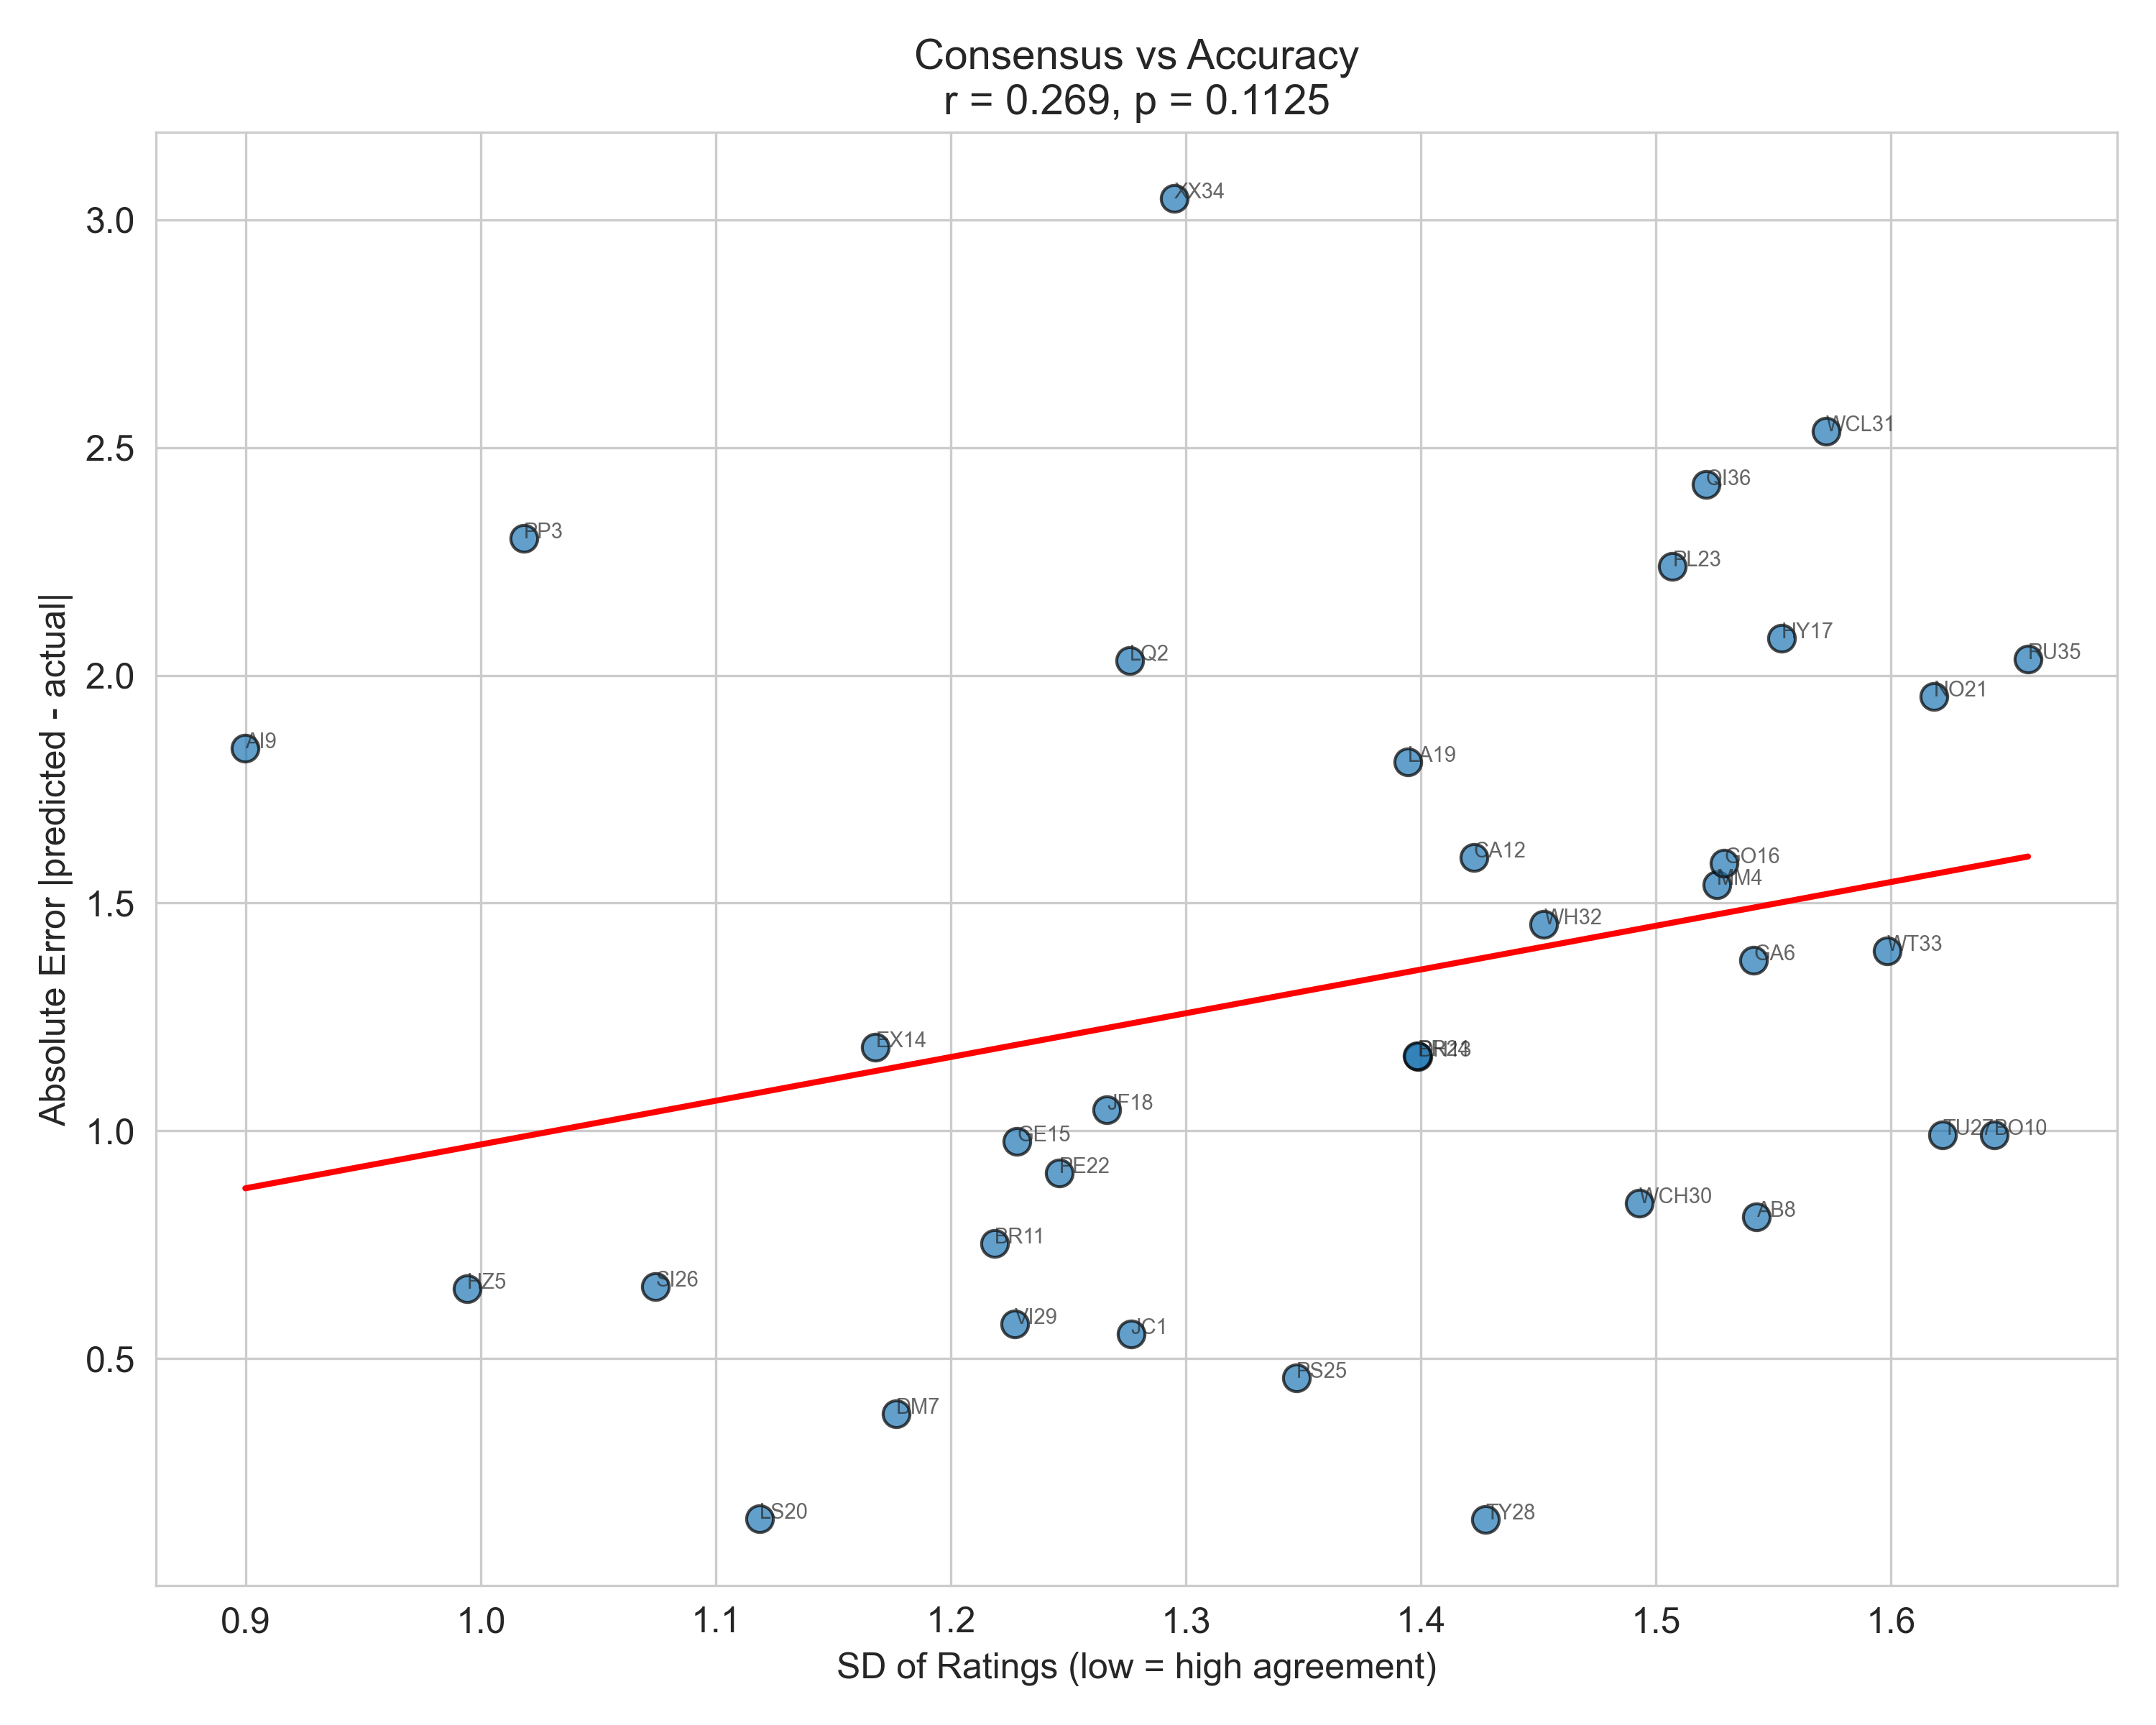
4A — Speaker consensus (SD of ratings) vs. absolute prediction error. r = 0.269, p = 0.113.
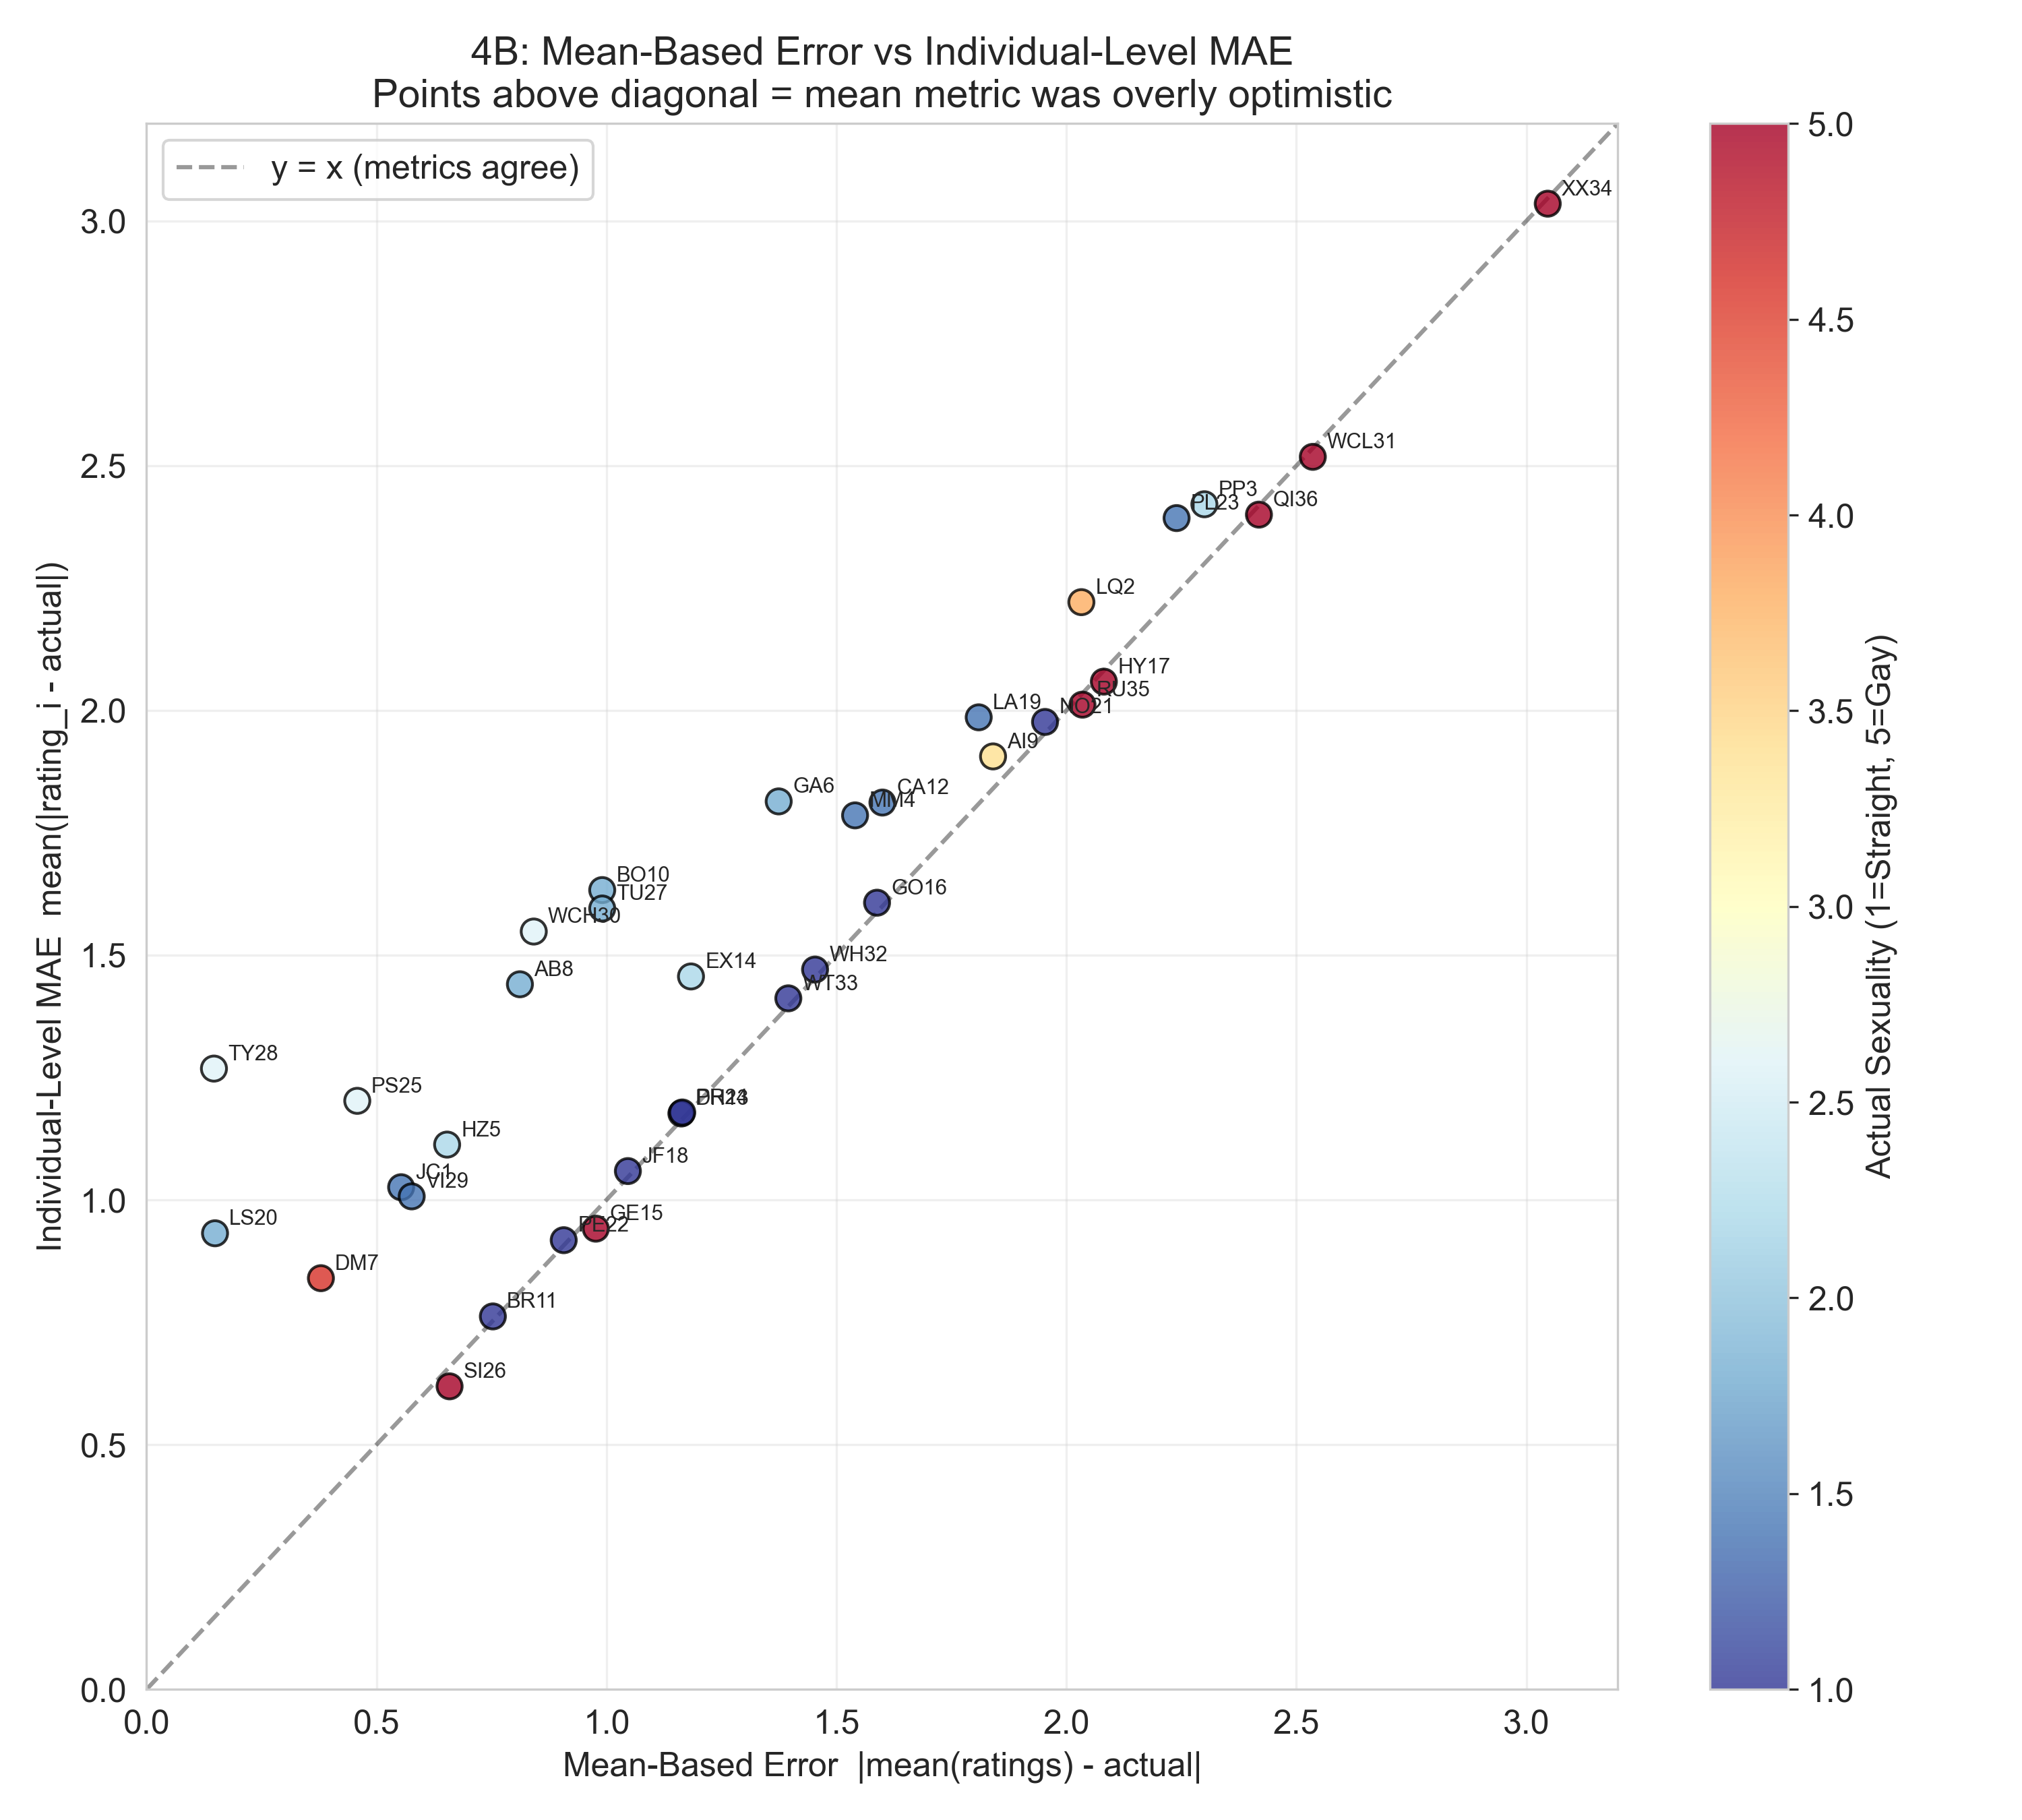
4B — Mean-based error vs. individual listener MAE by speaker.
Section 5: Speaker Characteristics & Clustering
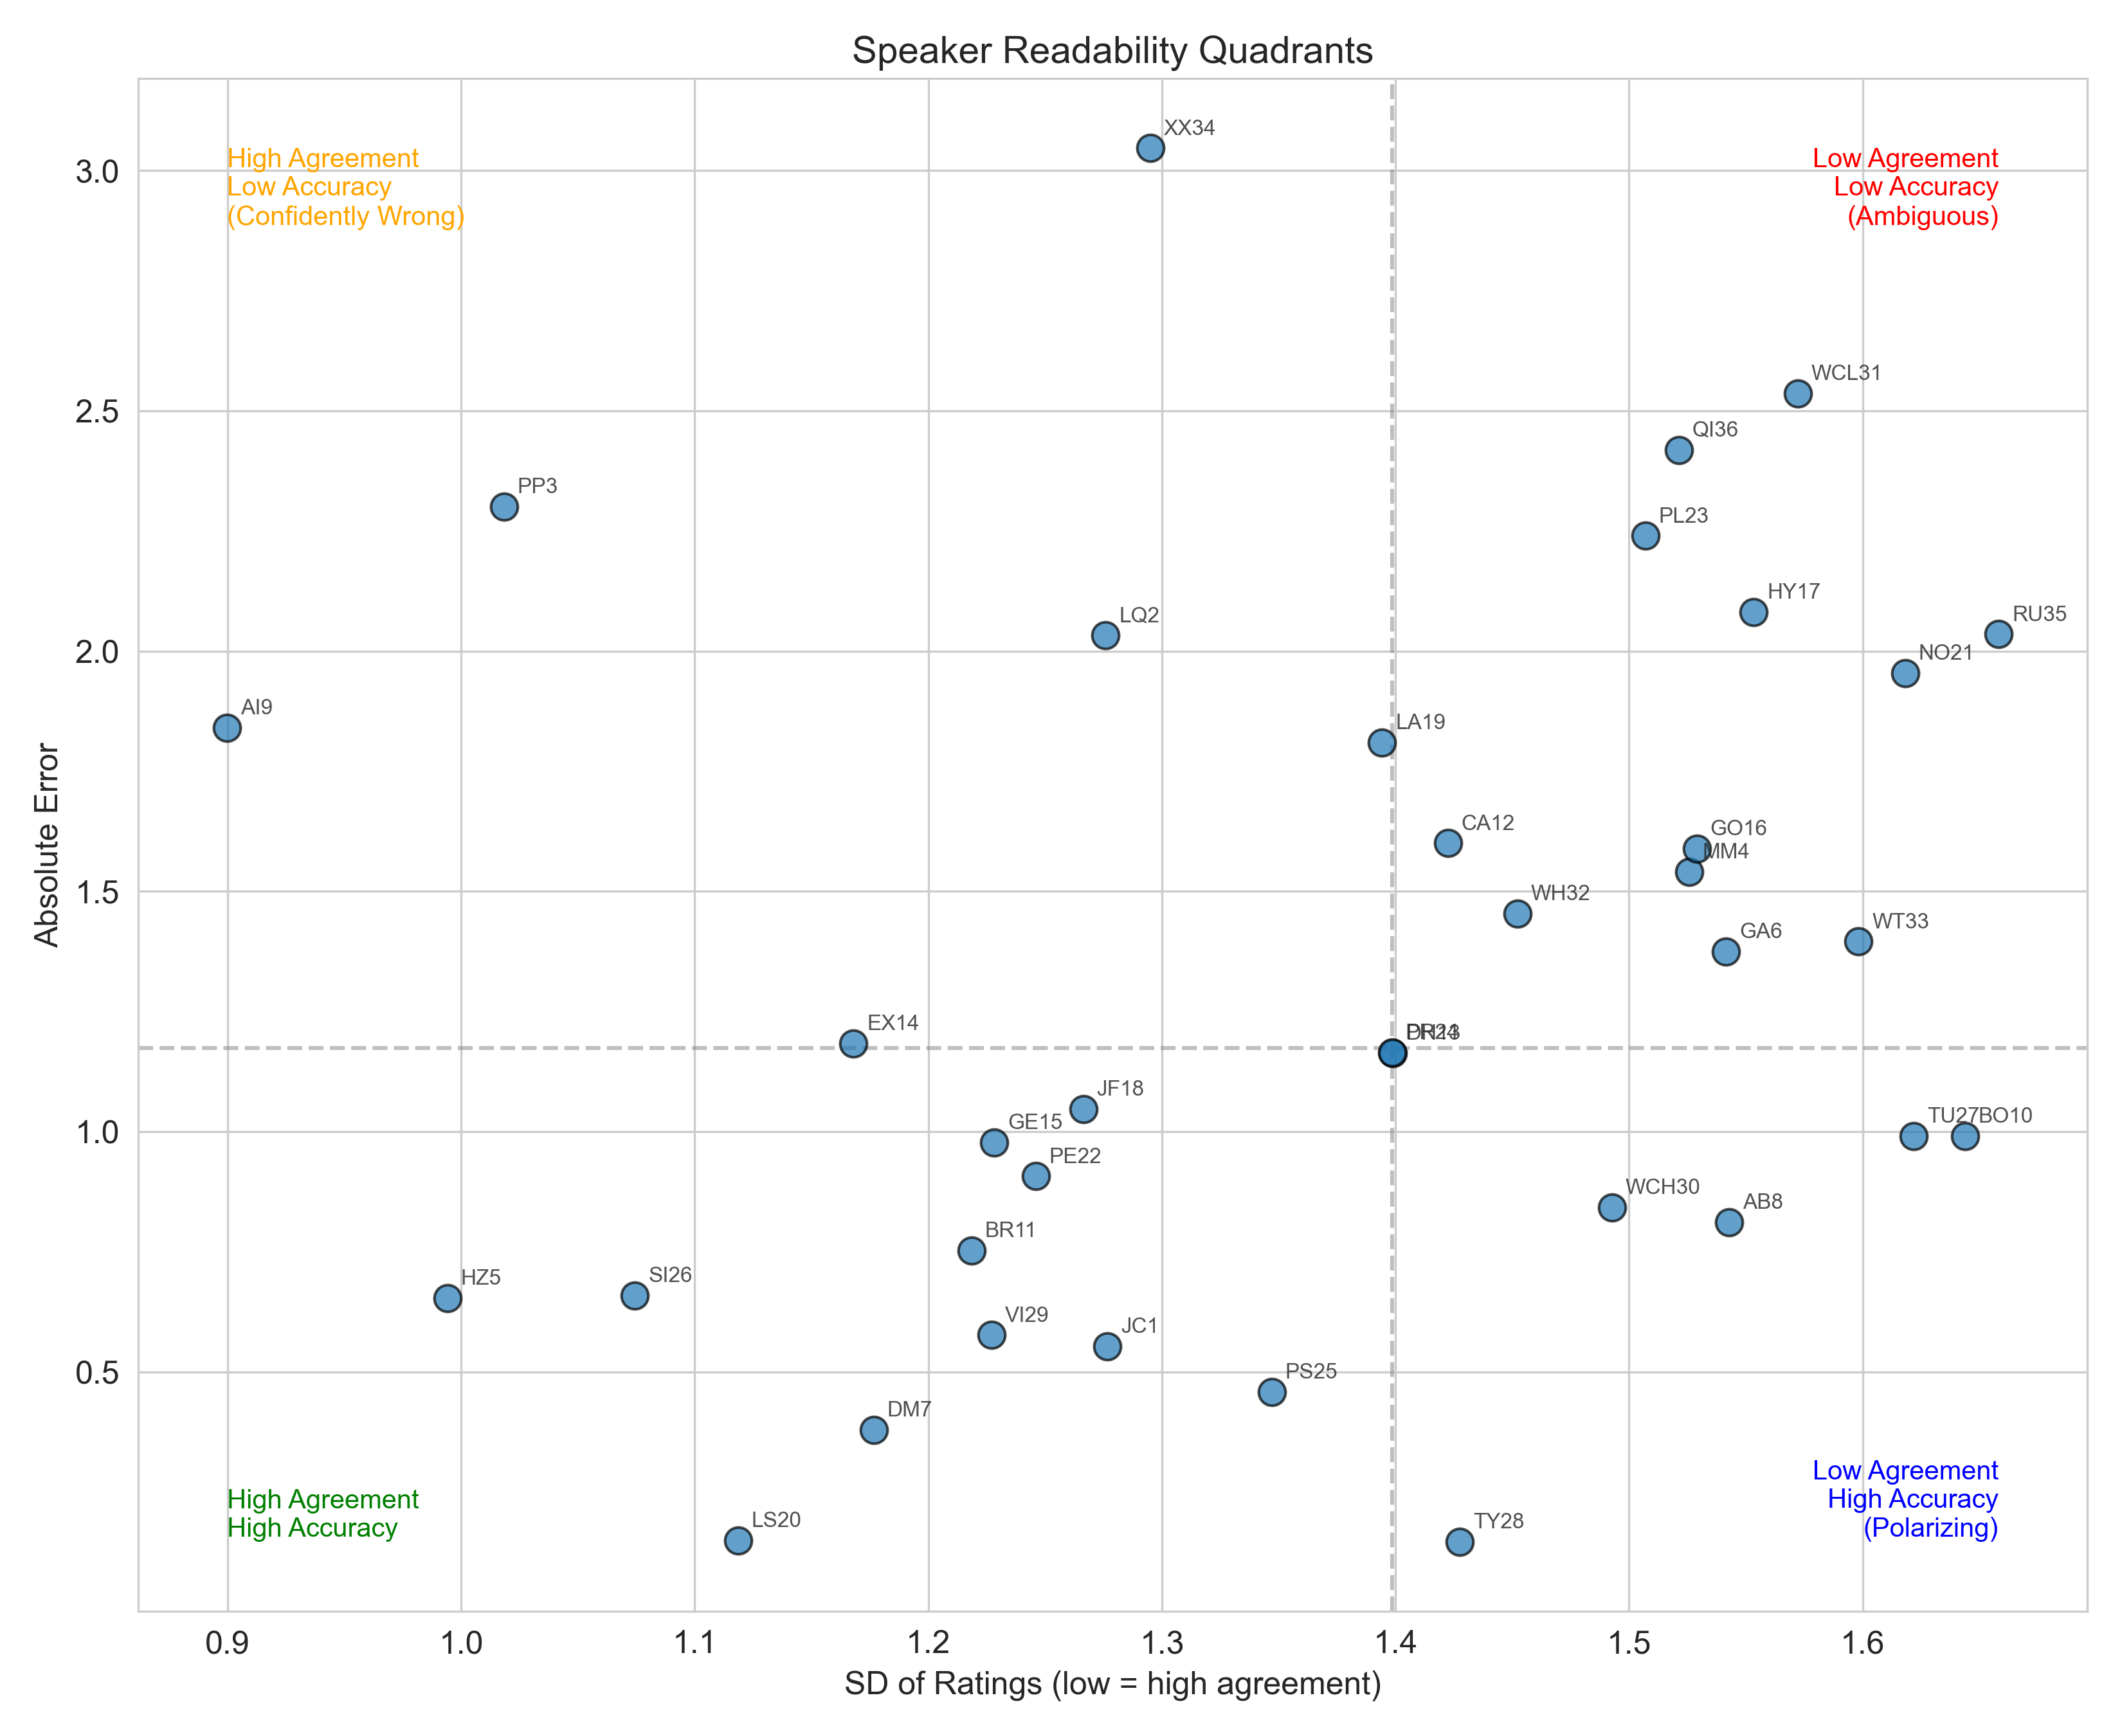
5A — Speaker readability quadrants: agreement (SD) vs. accuracy (absolute error).
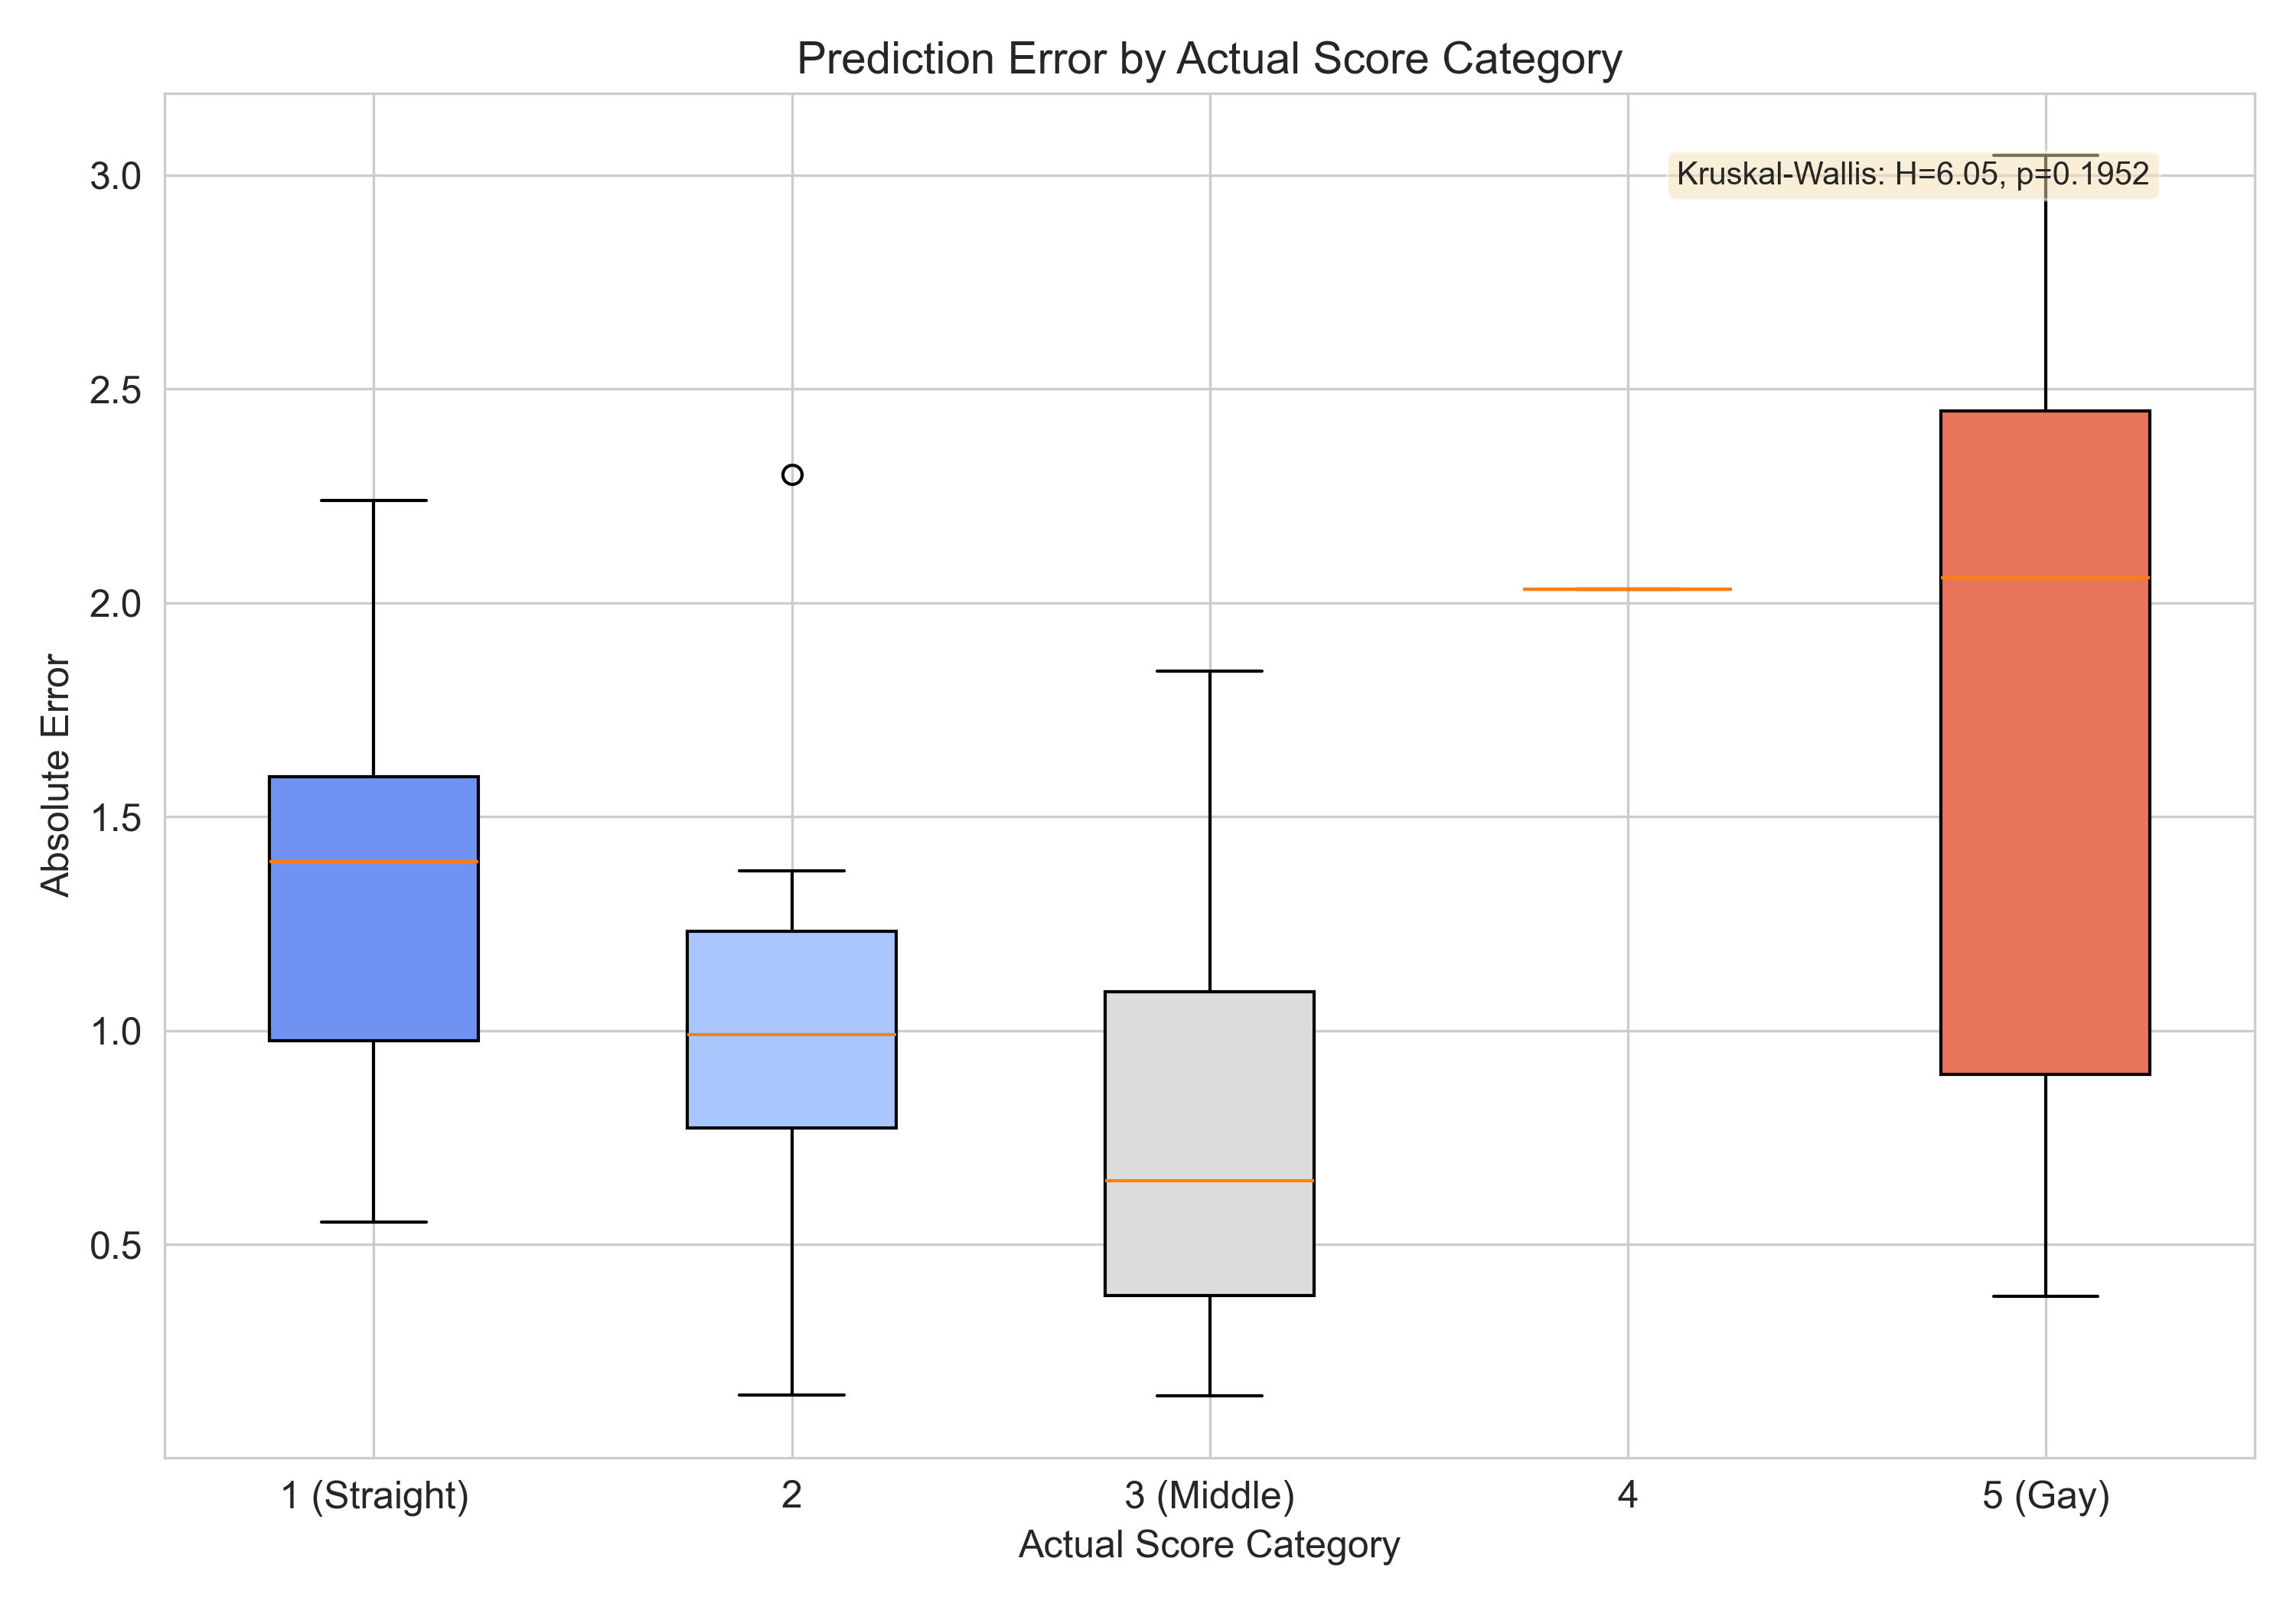
5B — Listener accuracy broken down by speakers' actual self-reported score.
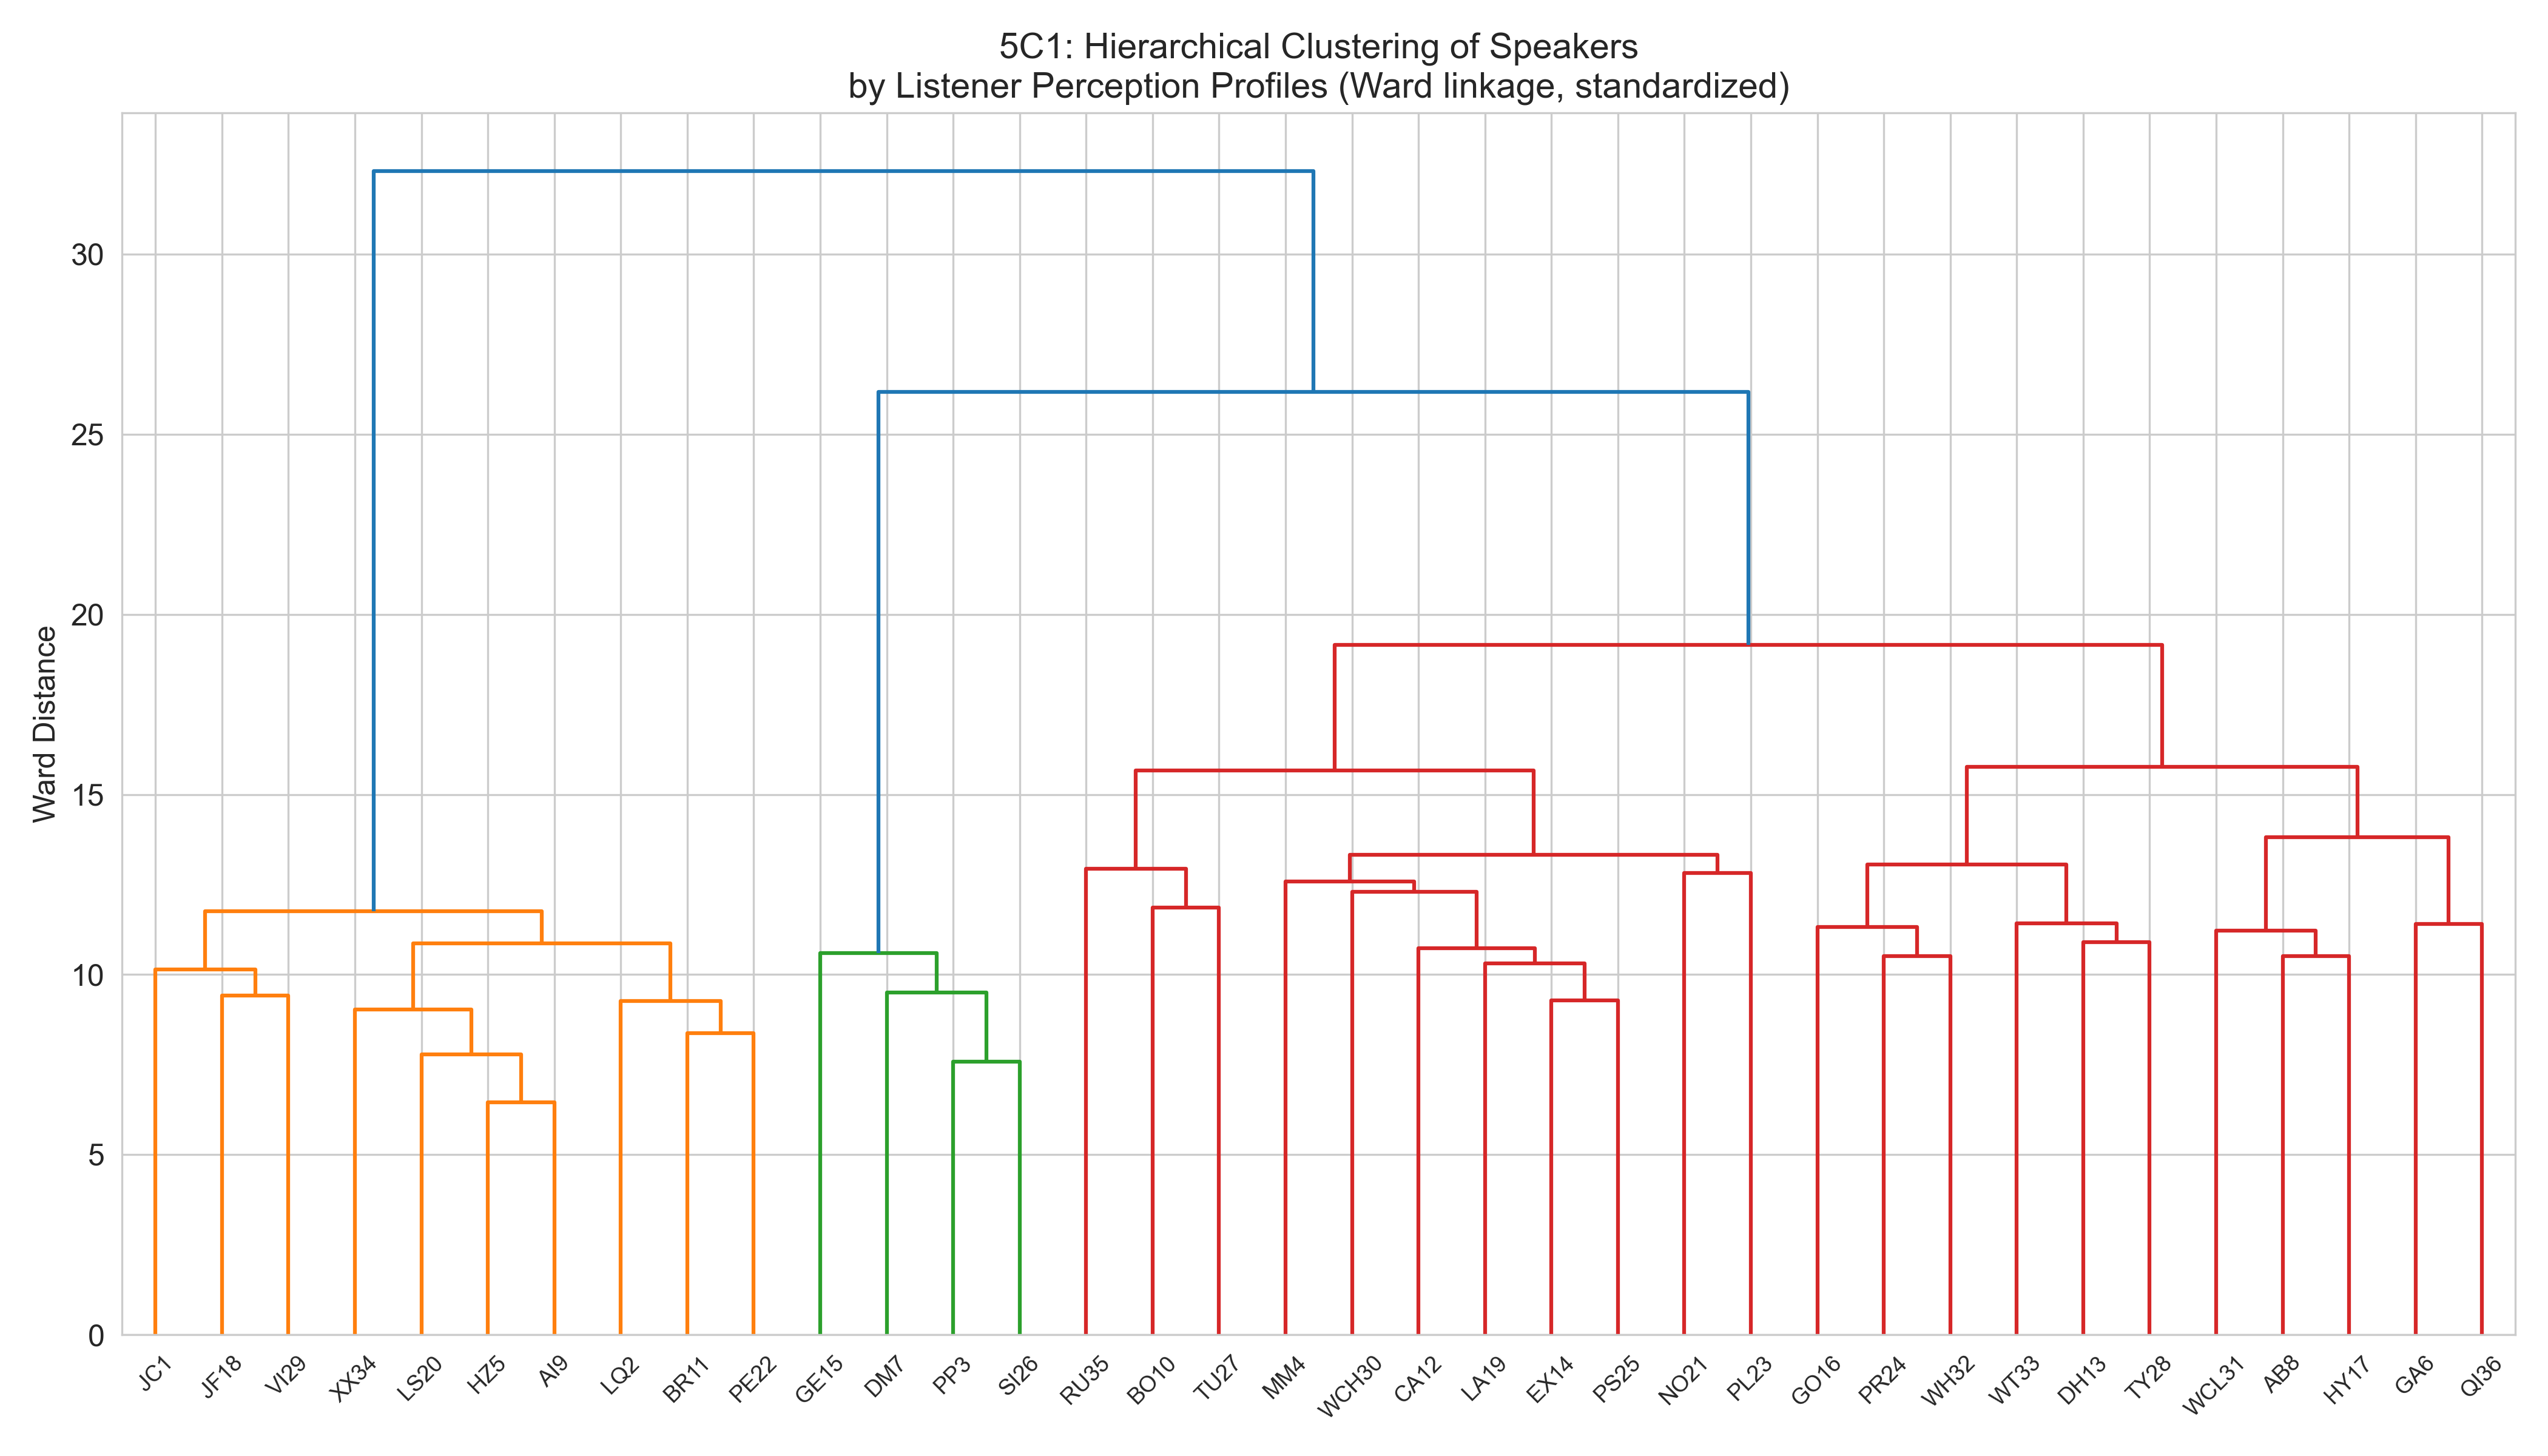
5C1 — Hierarchical clustering dendrogram of speaker rating profiles.
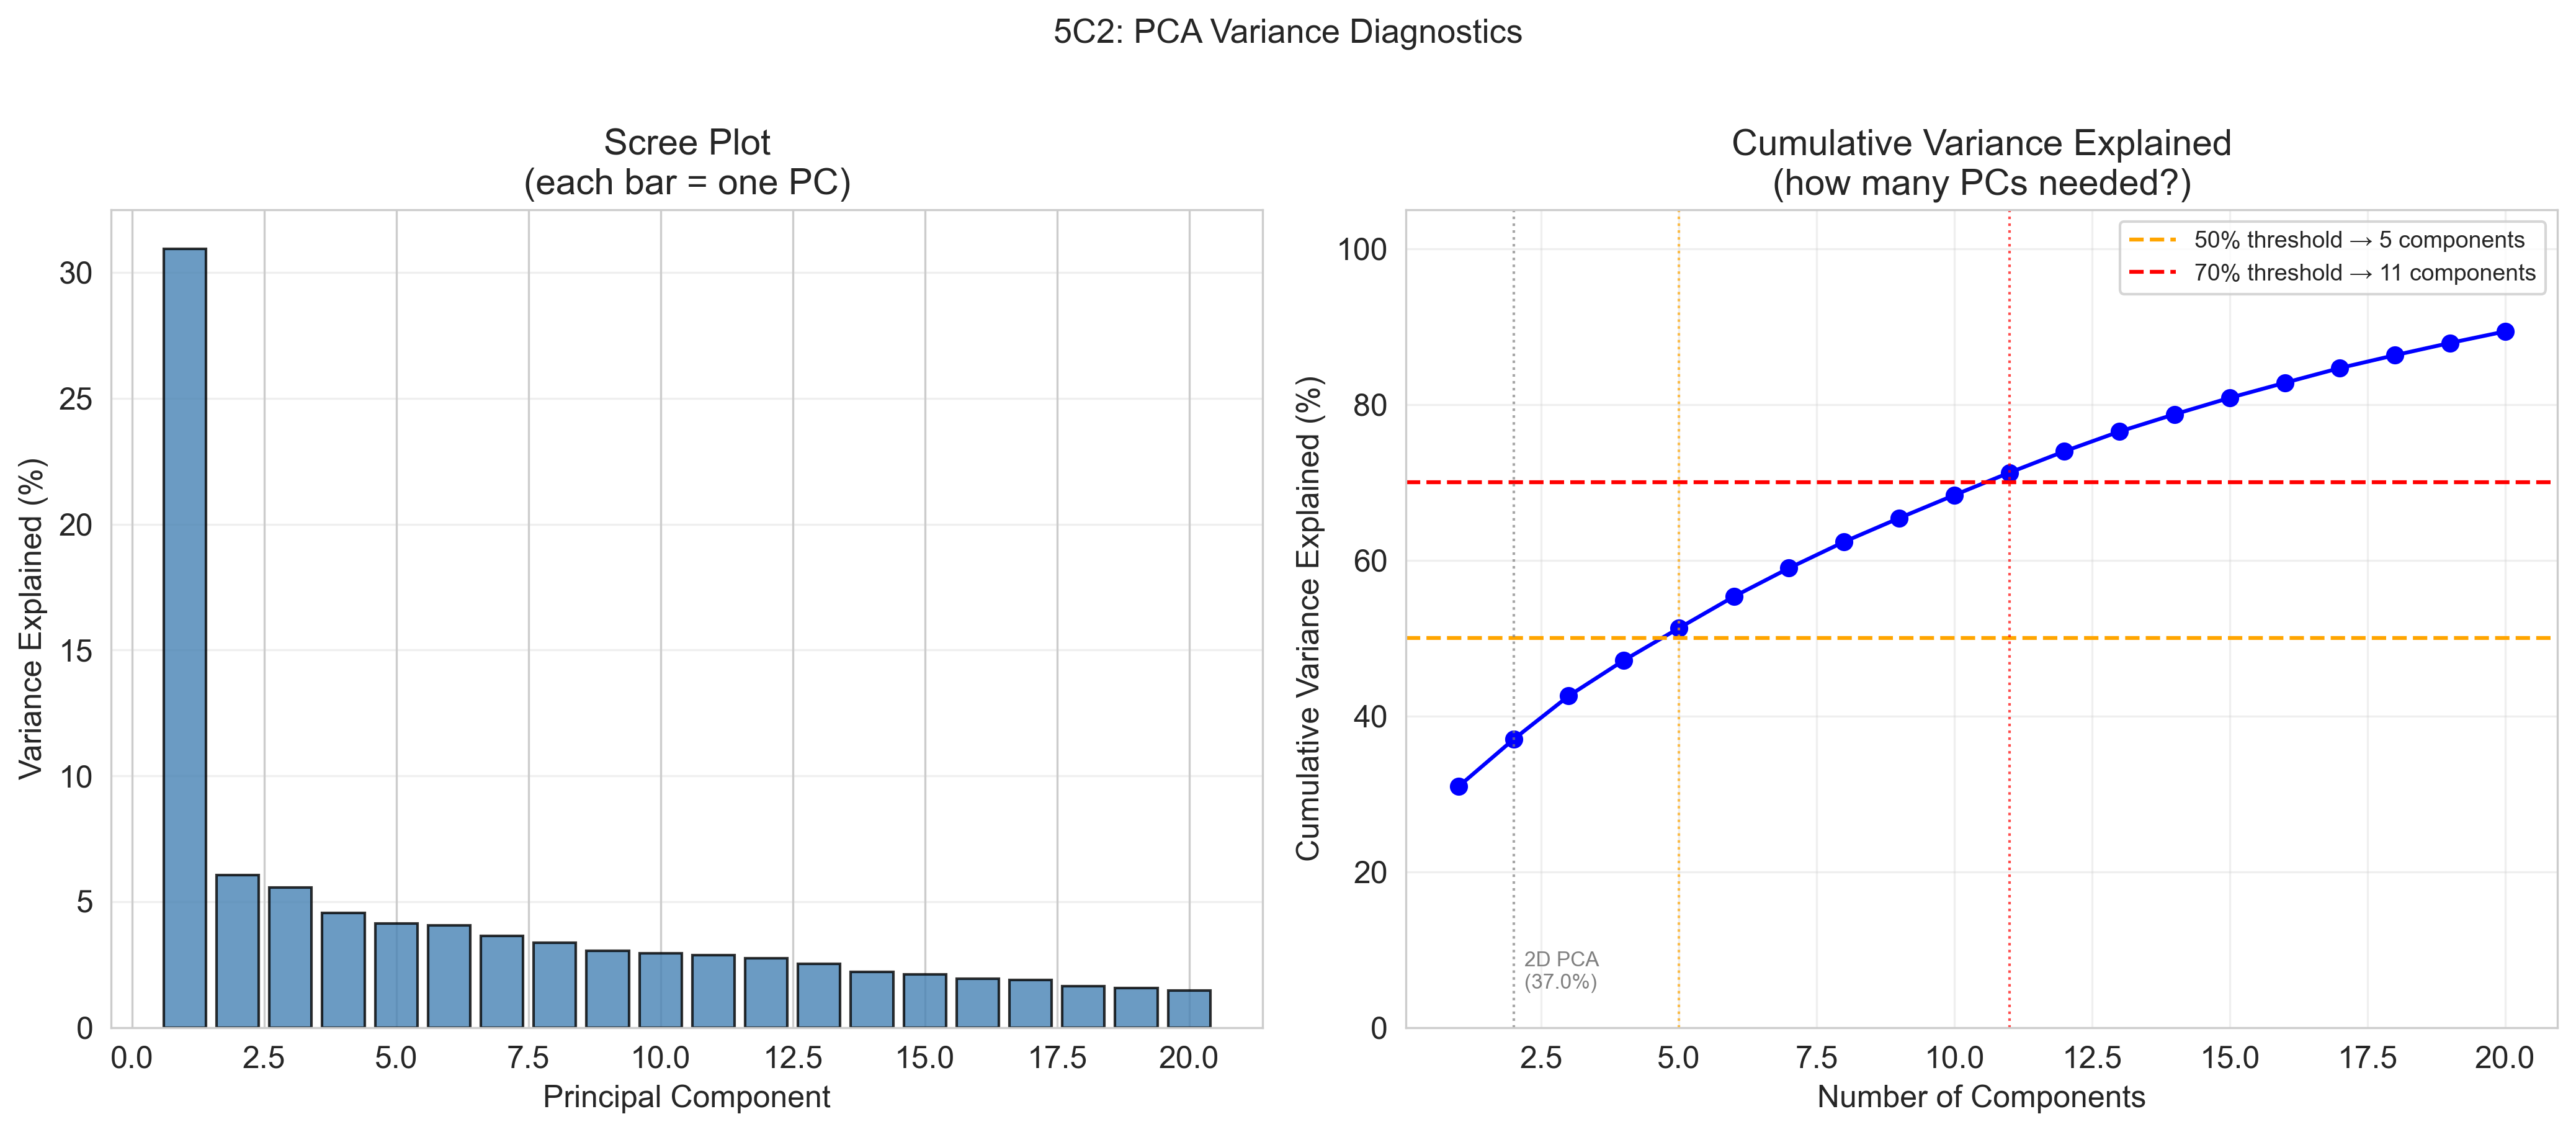
5C2 — PCA variance diagnostics for speaker rating profiles.
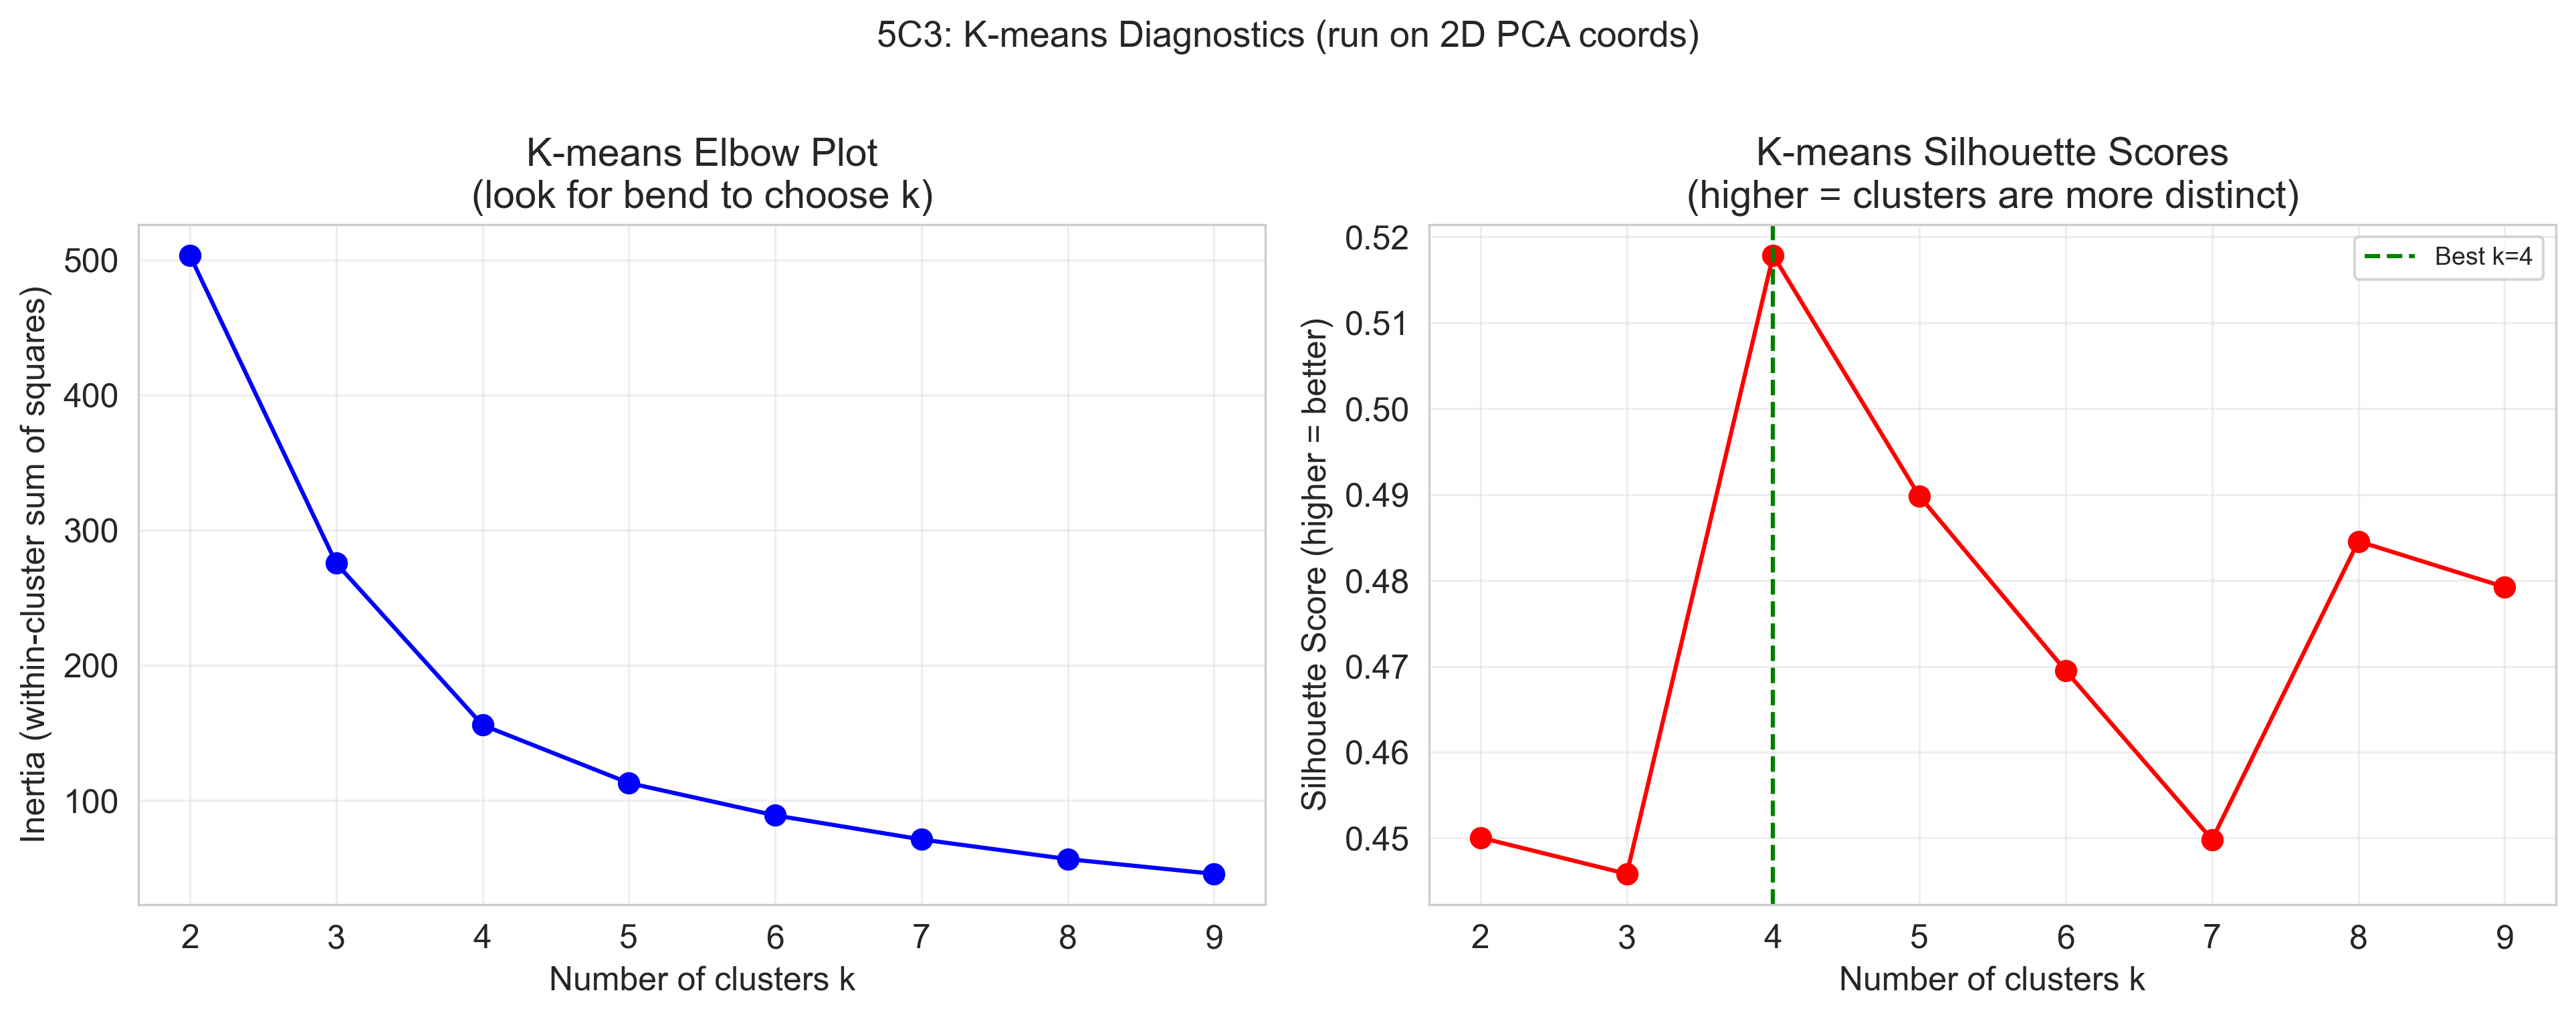
5C3 — K-means clustering diagnostics (elbow plot).
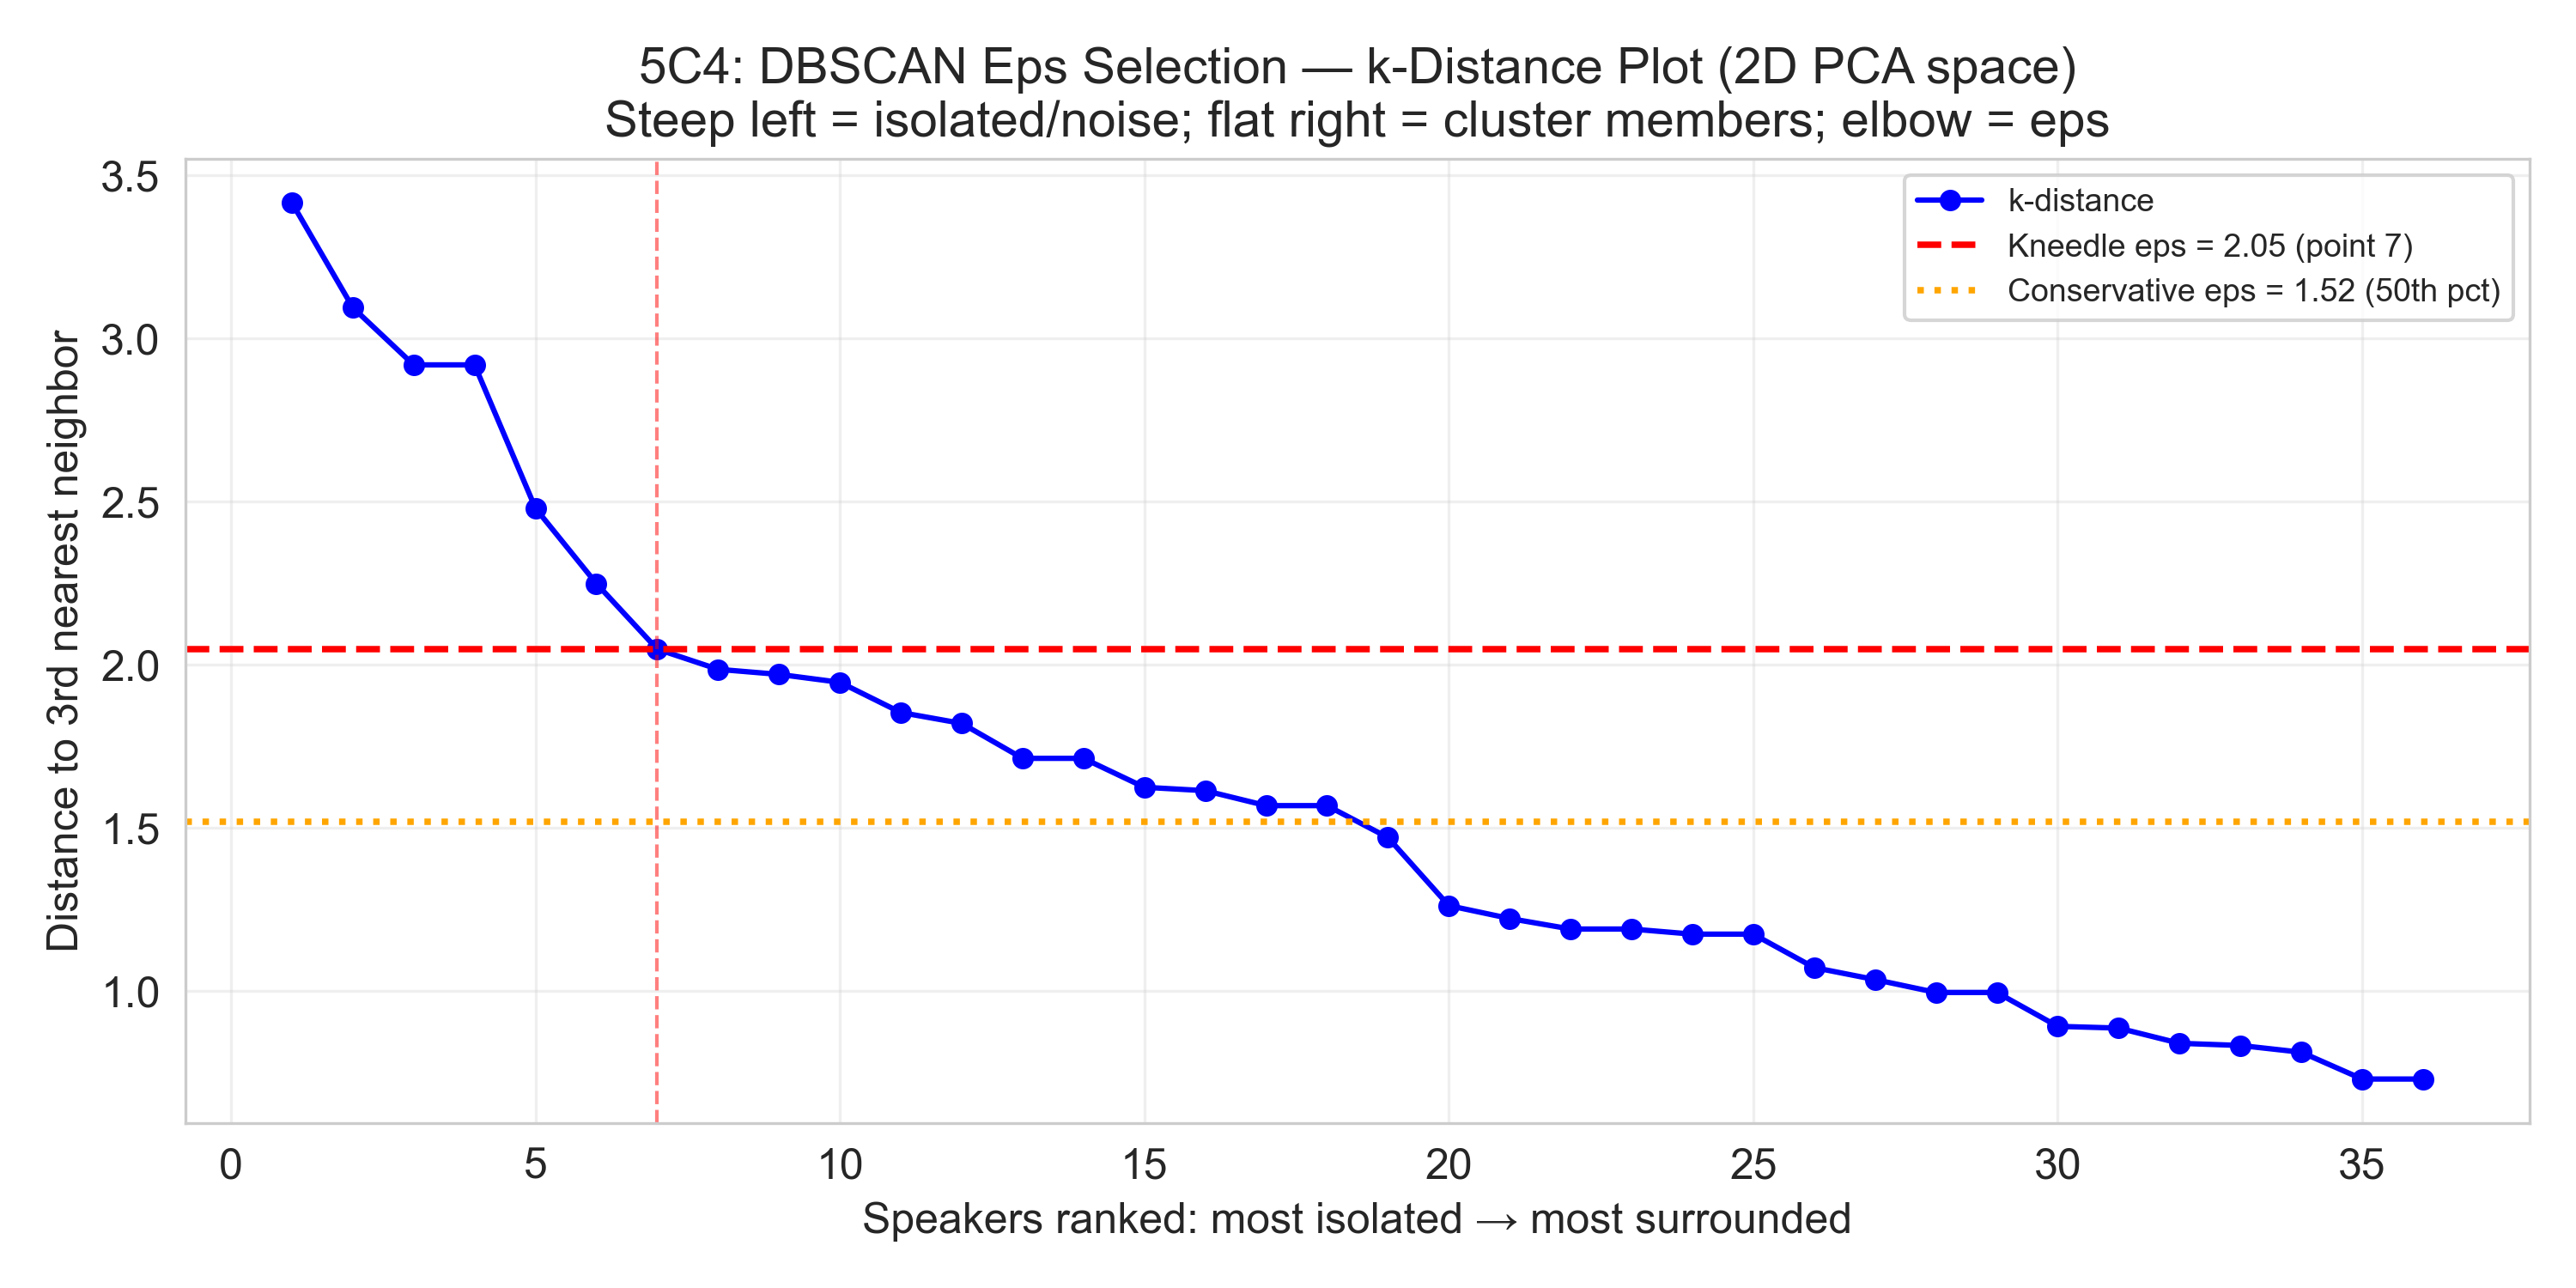
5C4 — DBSCAN k-distance plot (2D PCA space).
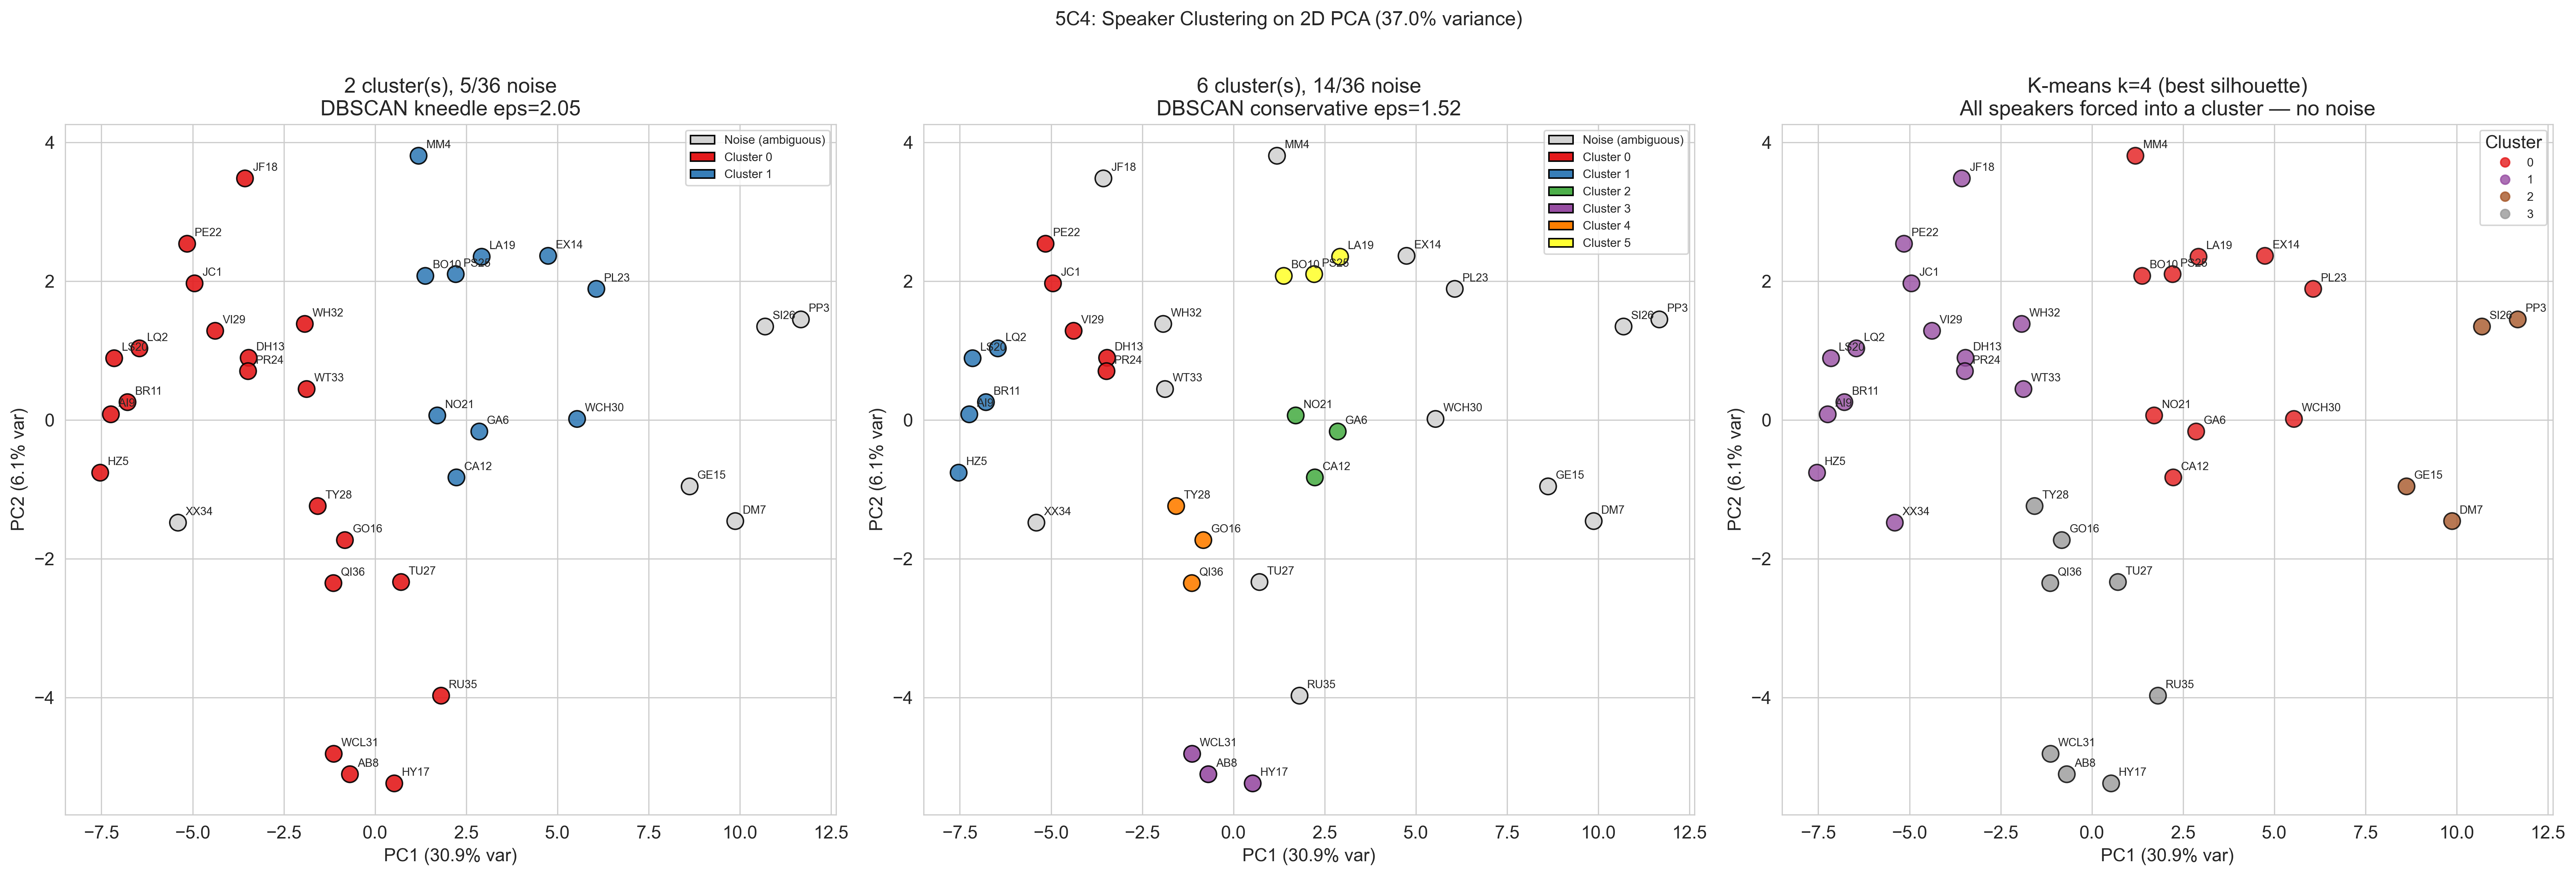
5C4 — Clustering comparison in 2D PCA space.
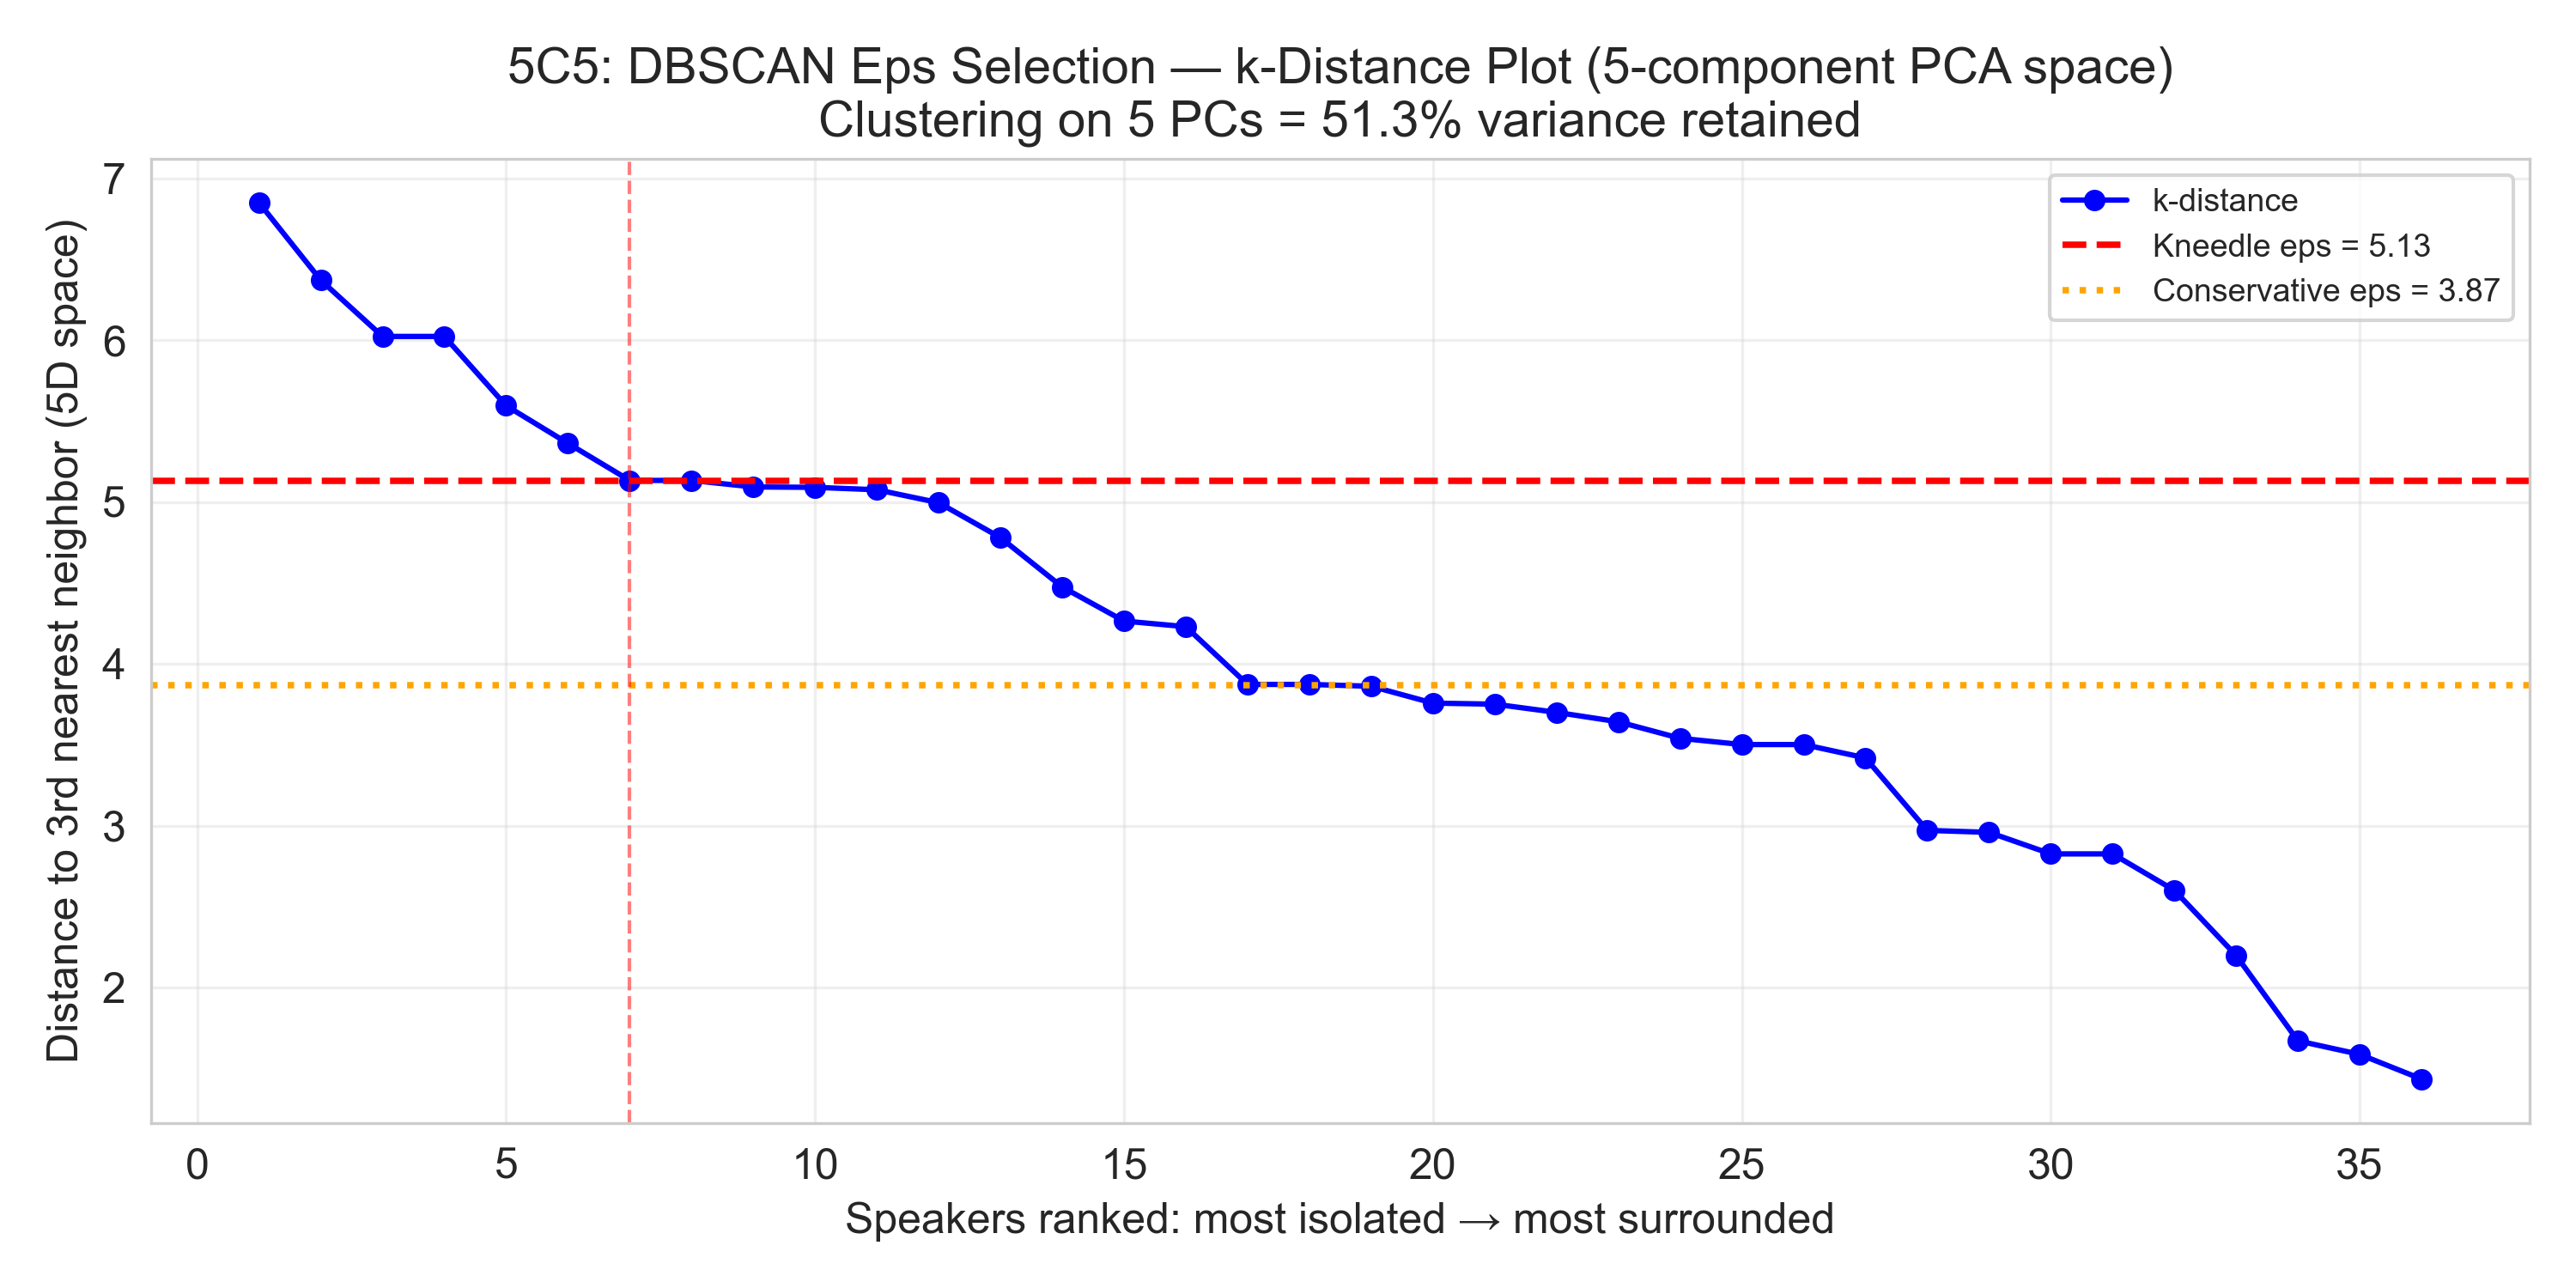
5C5 — DBSCAN k-distance plot (50% variance).
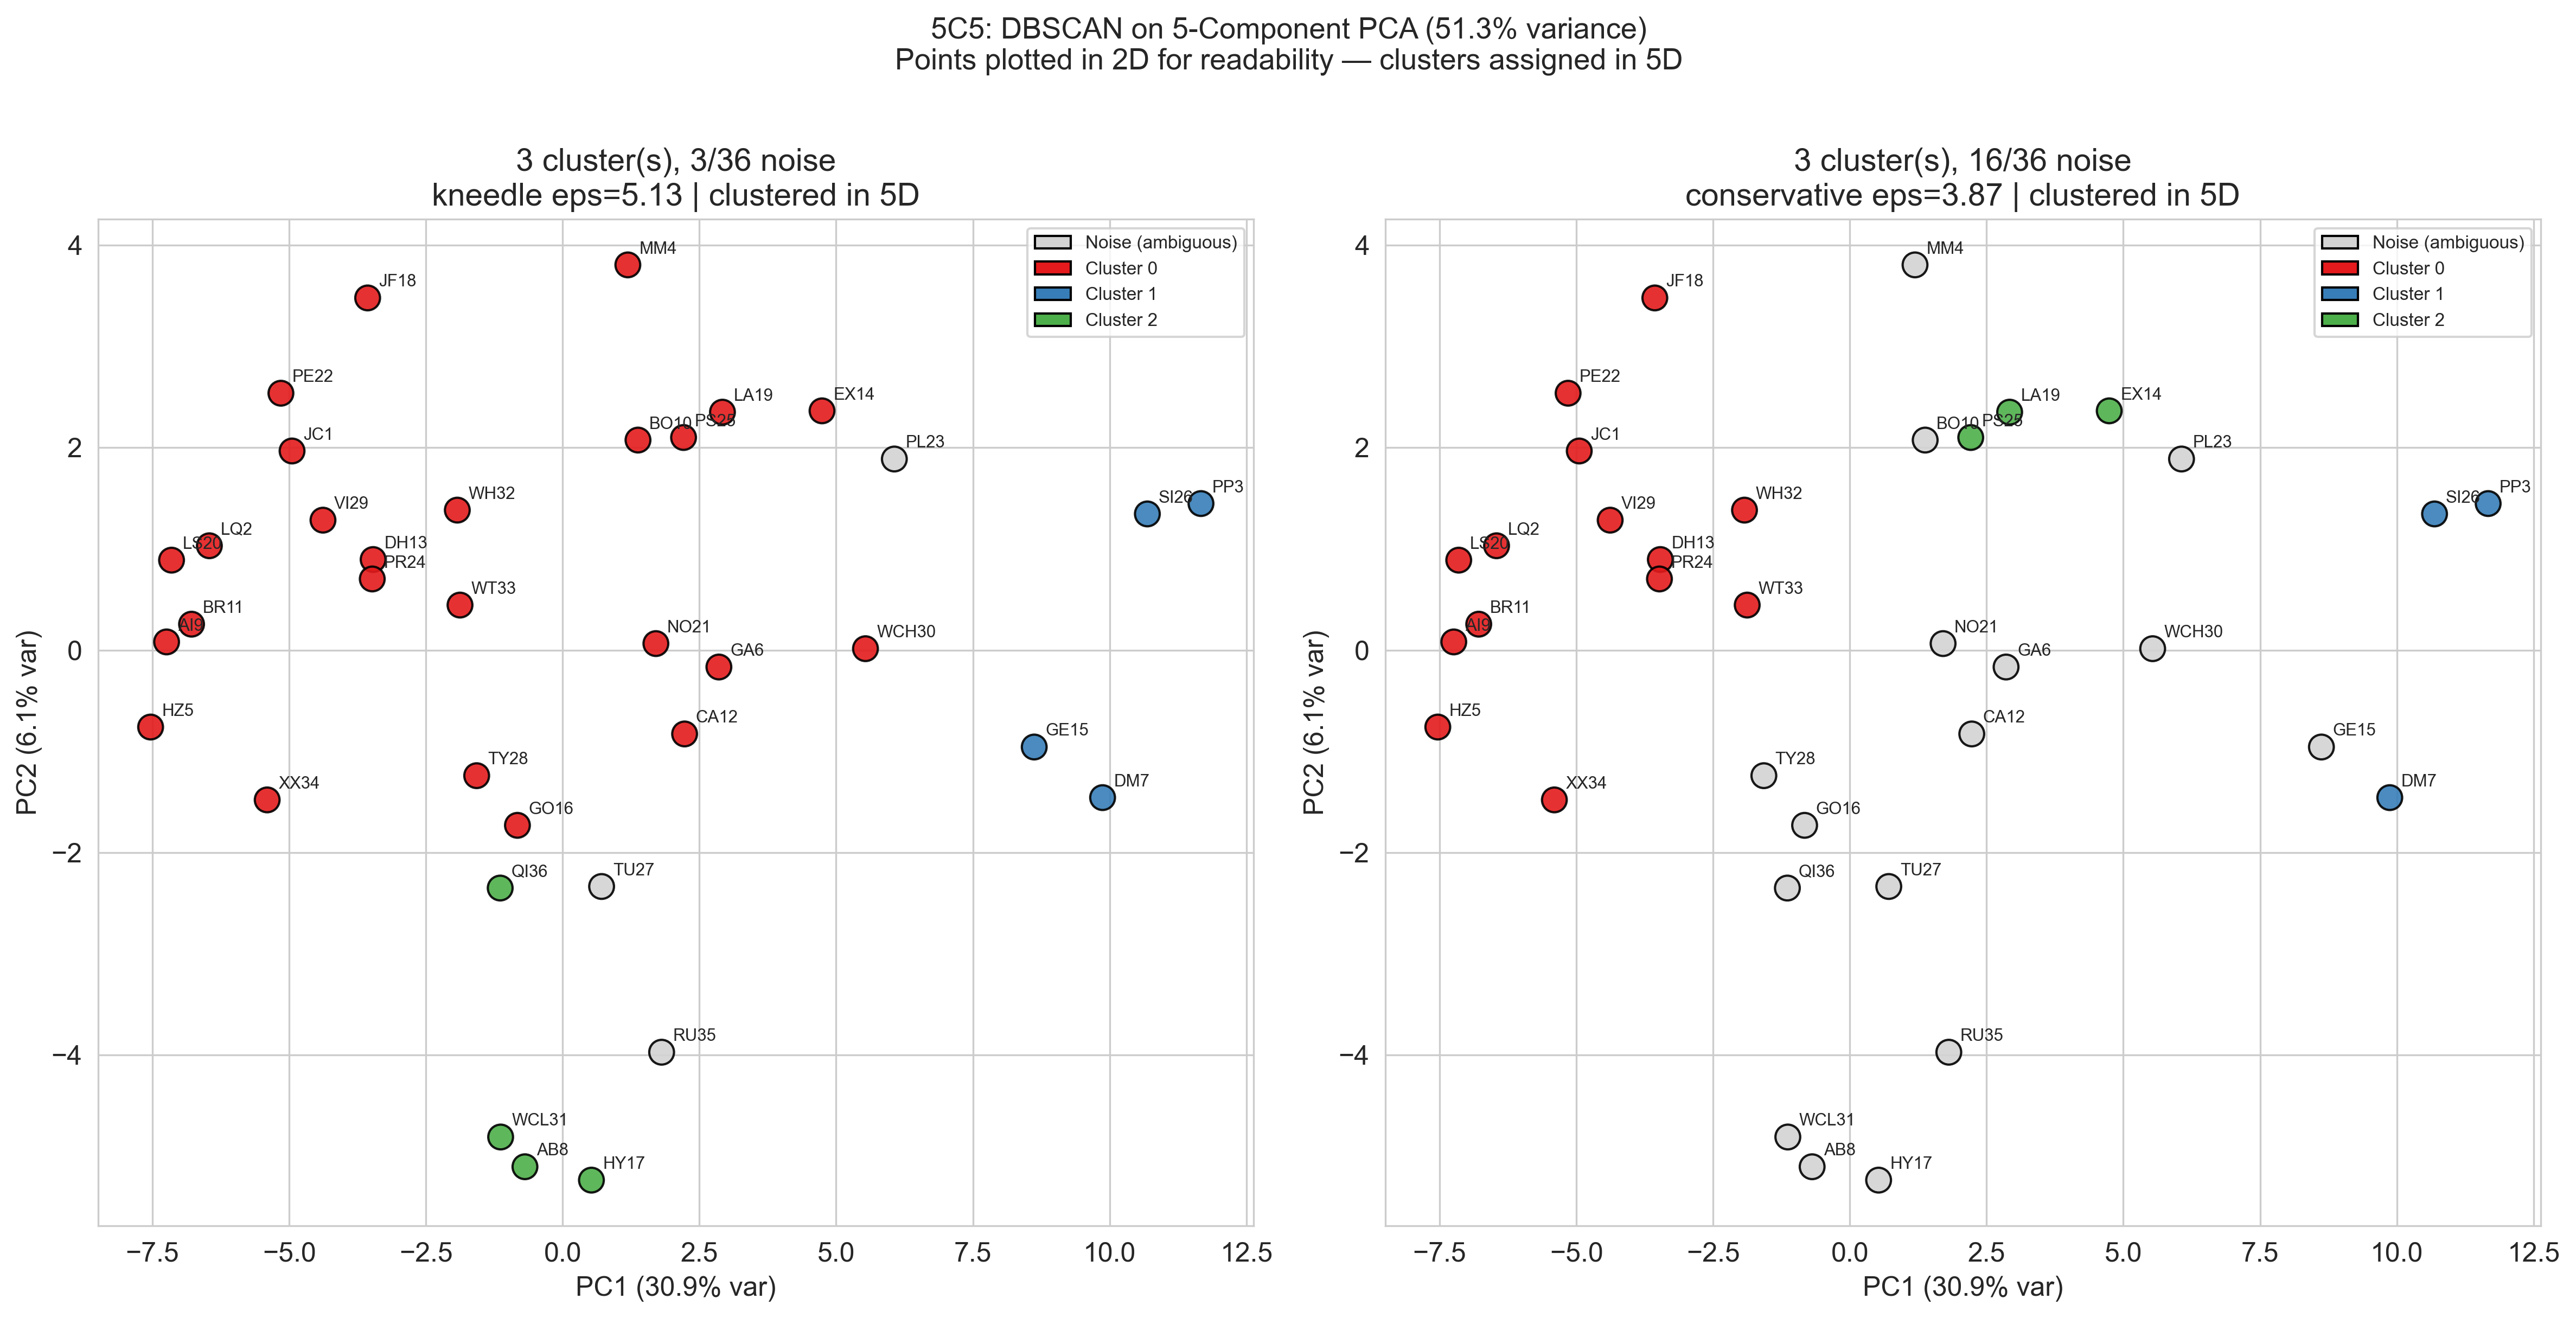
5C5 — Clustering in 50% variance PCA space.
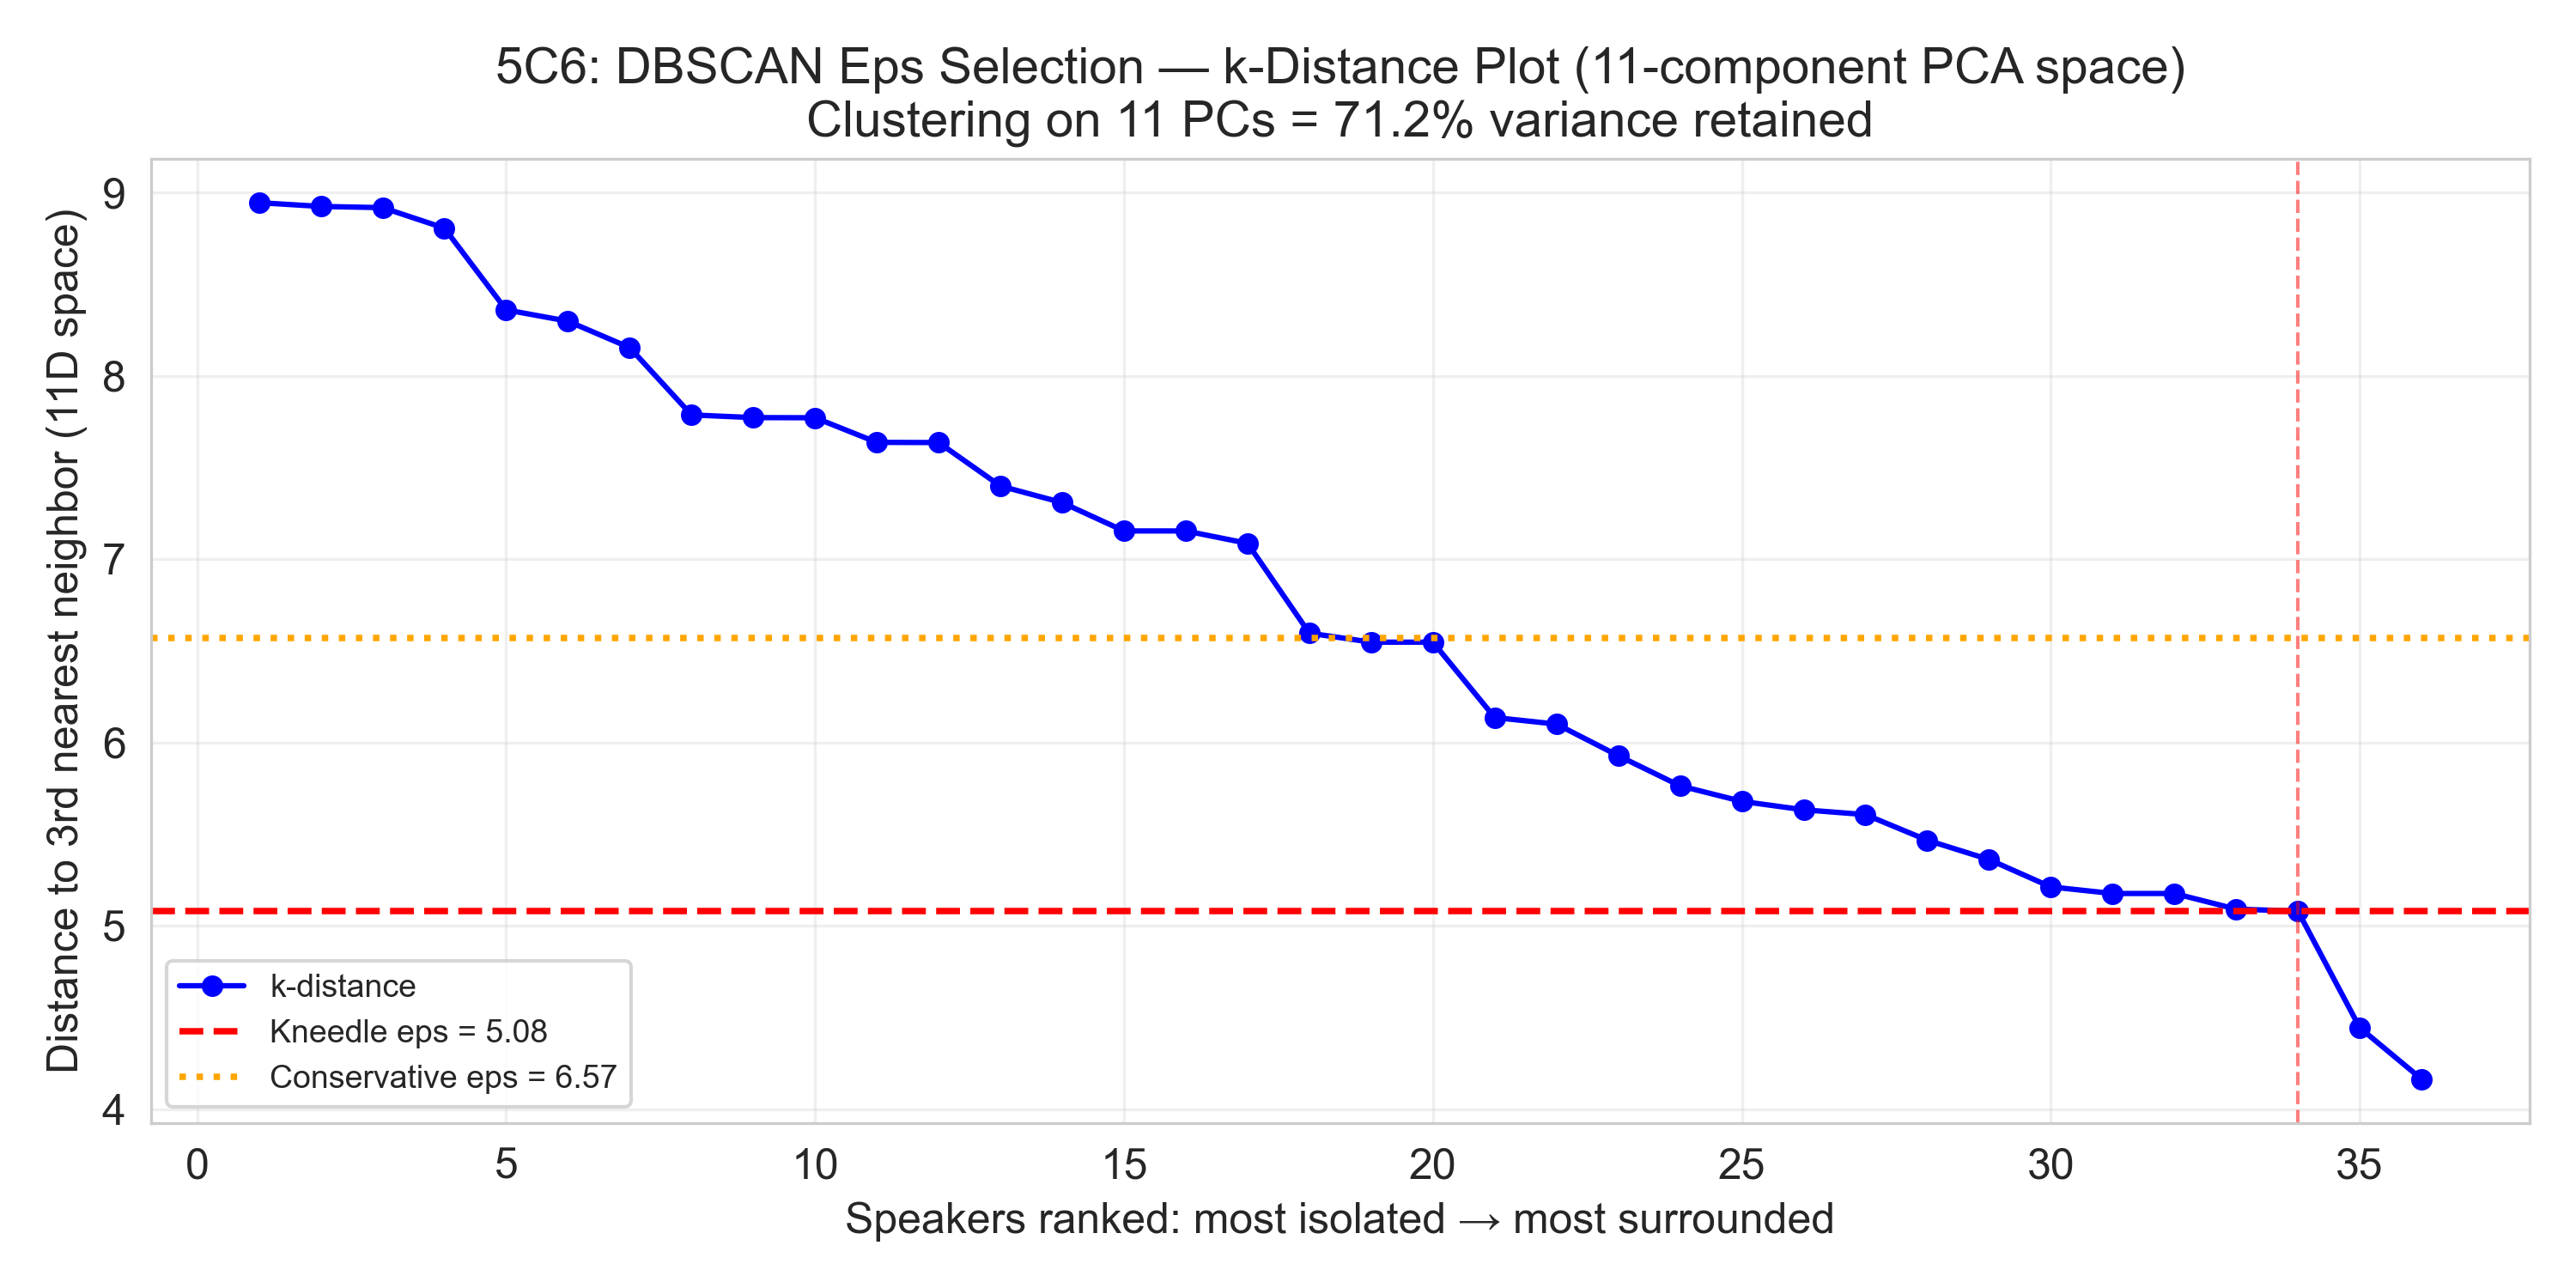
5C6 — DBSCAN k-distance plot (70% variance).
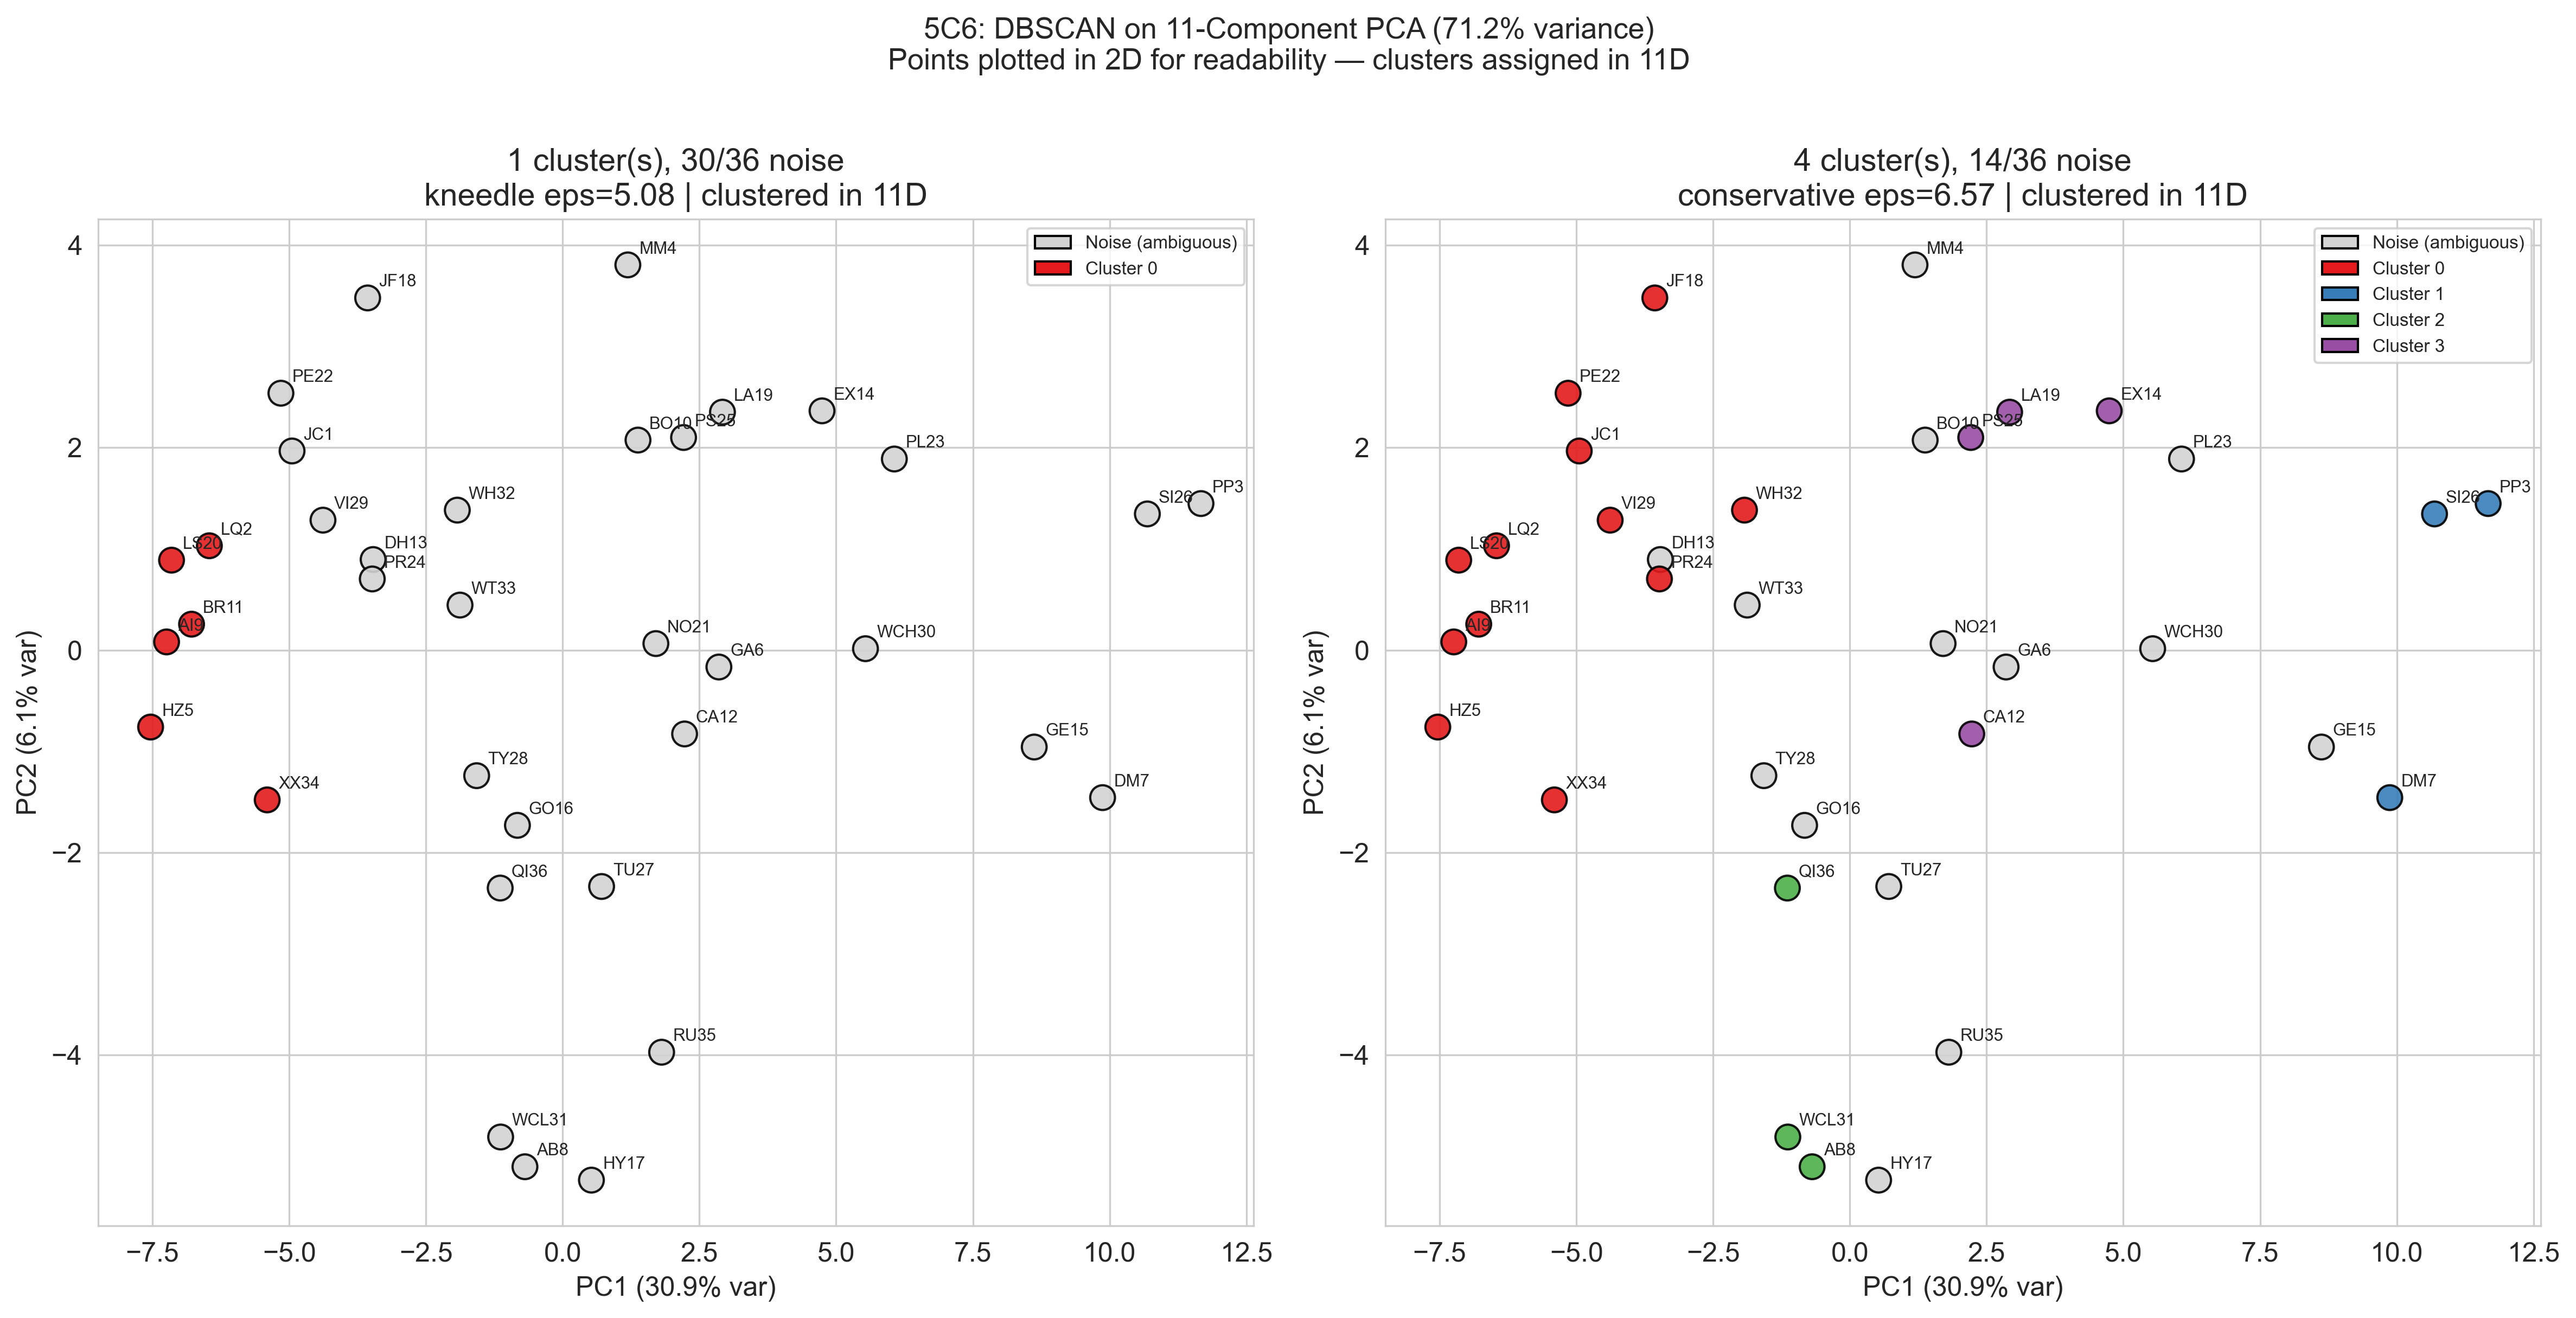
5C6 — Clustering in 70% variance PCA space.
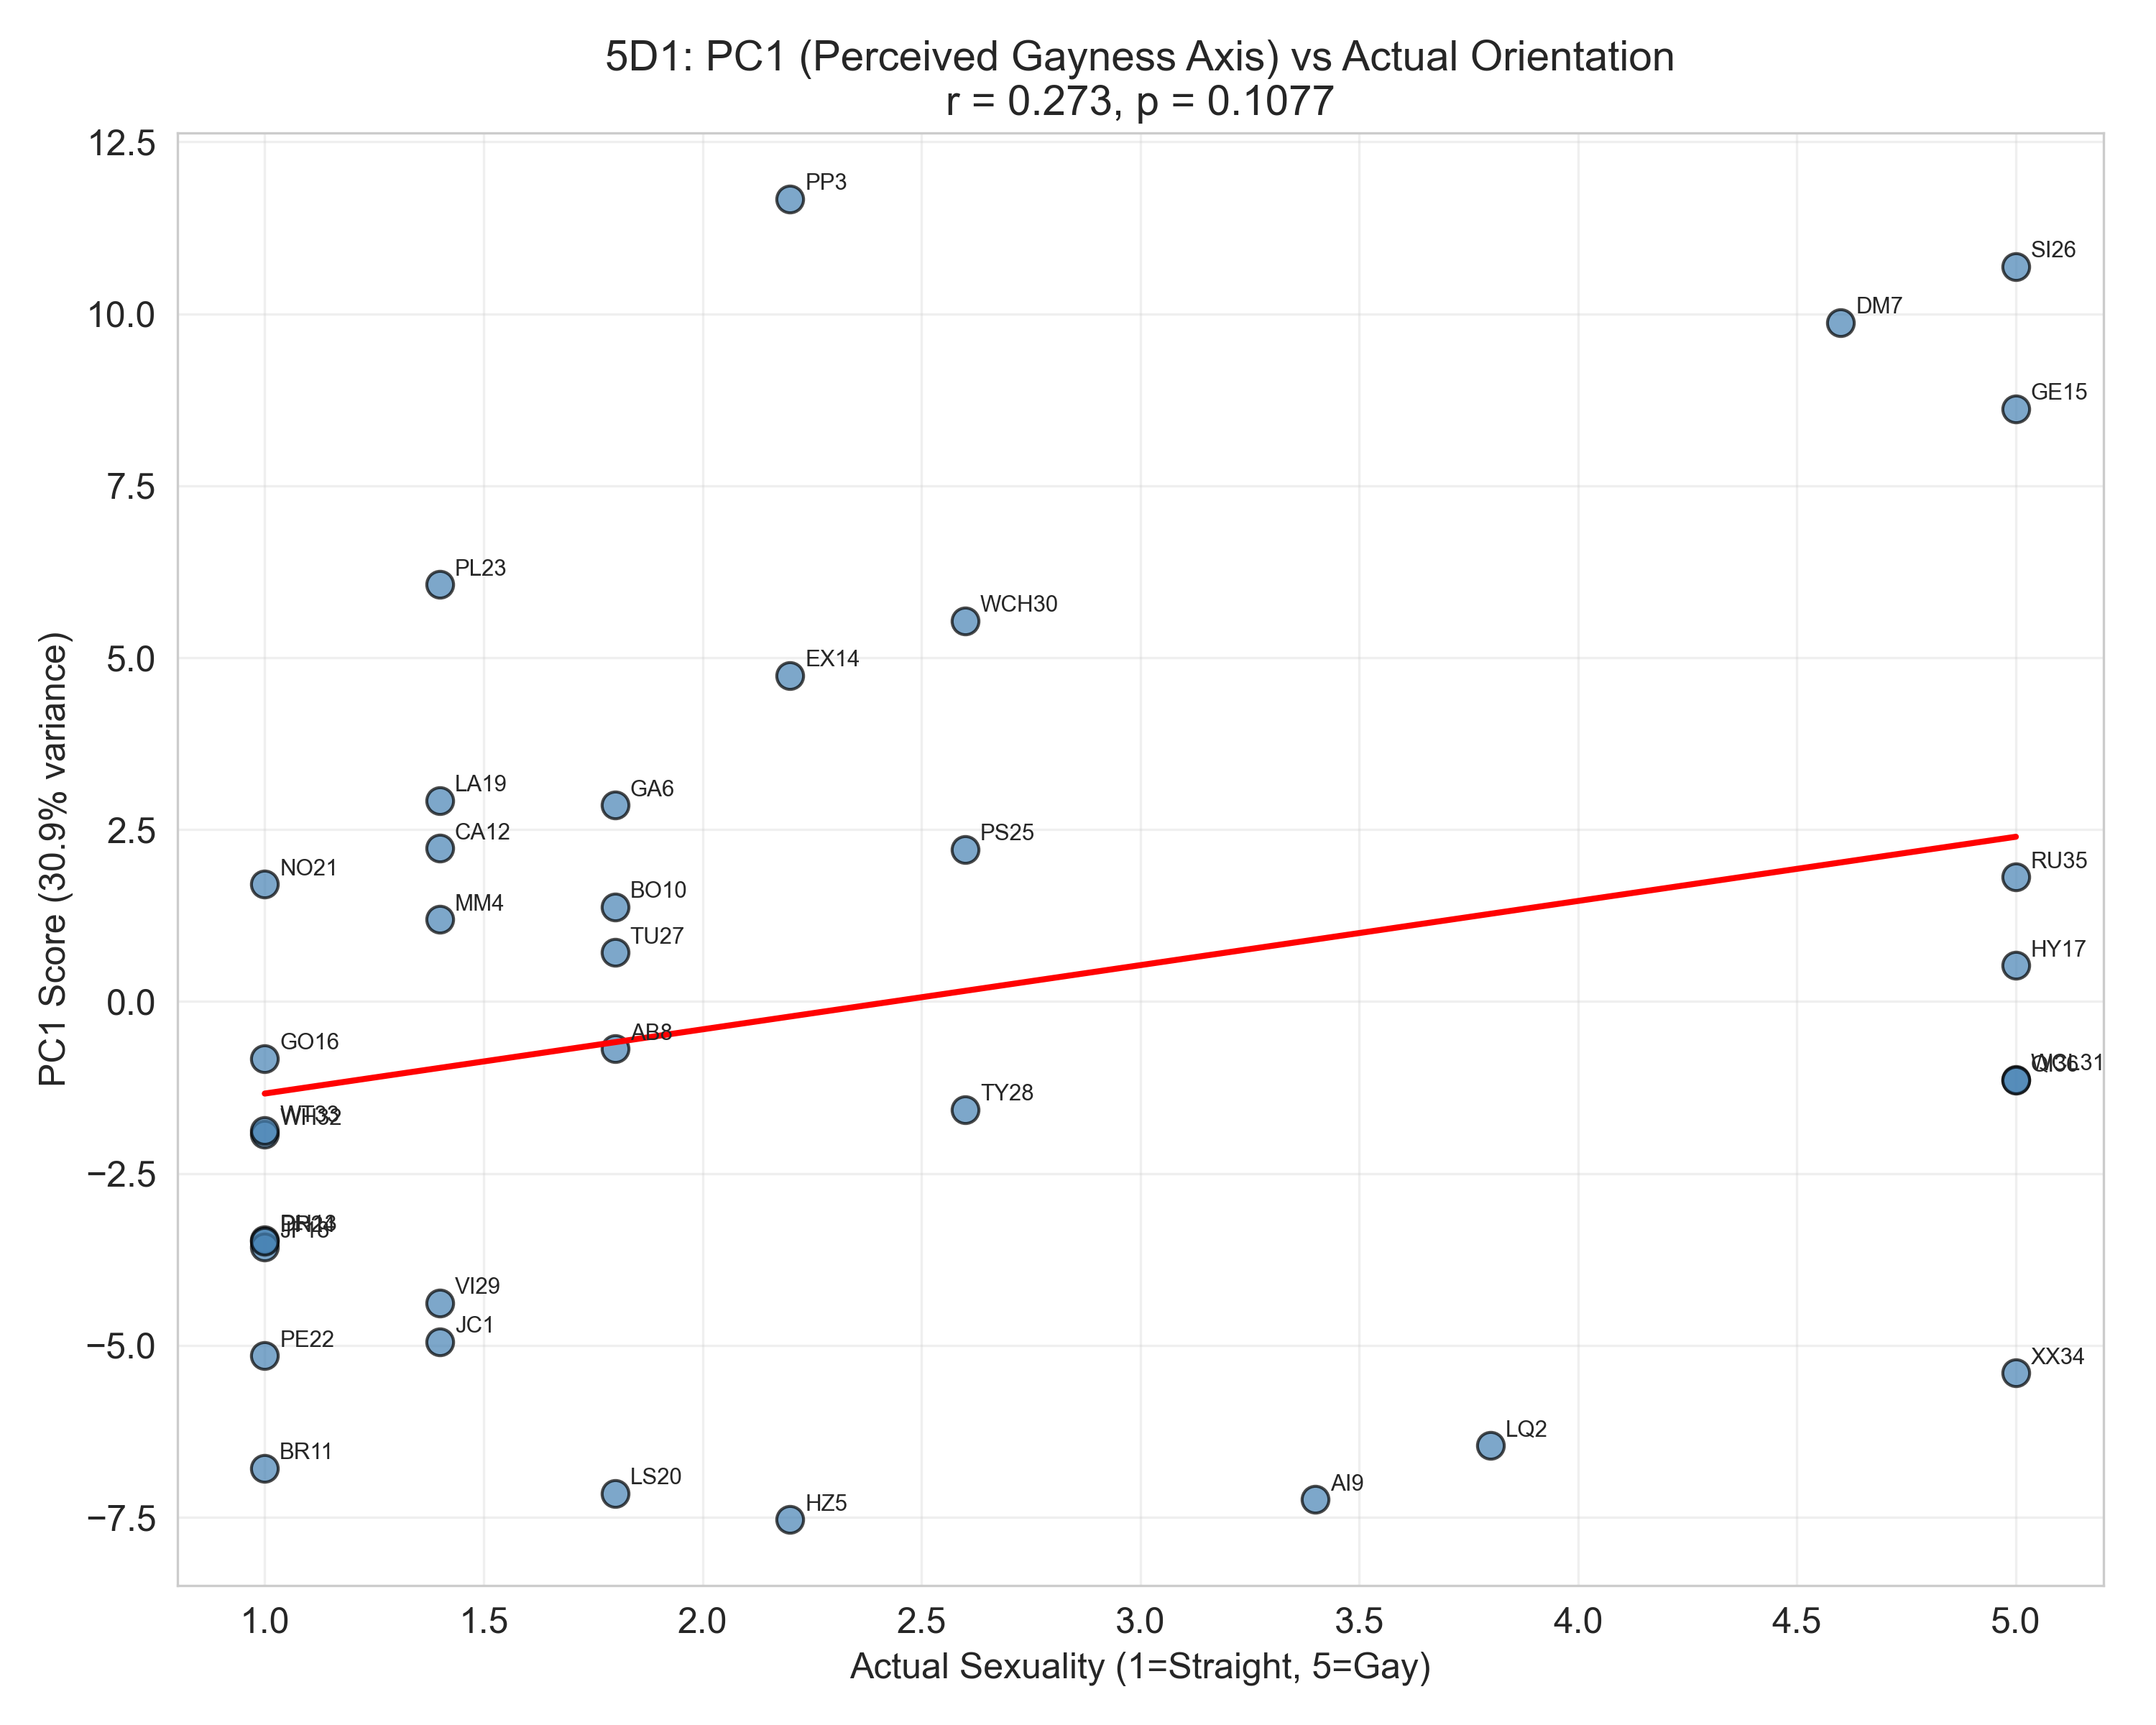
5D1 — PC1 score vs. speakers' actual self-reported sexuality.
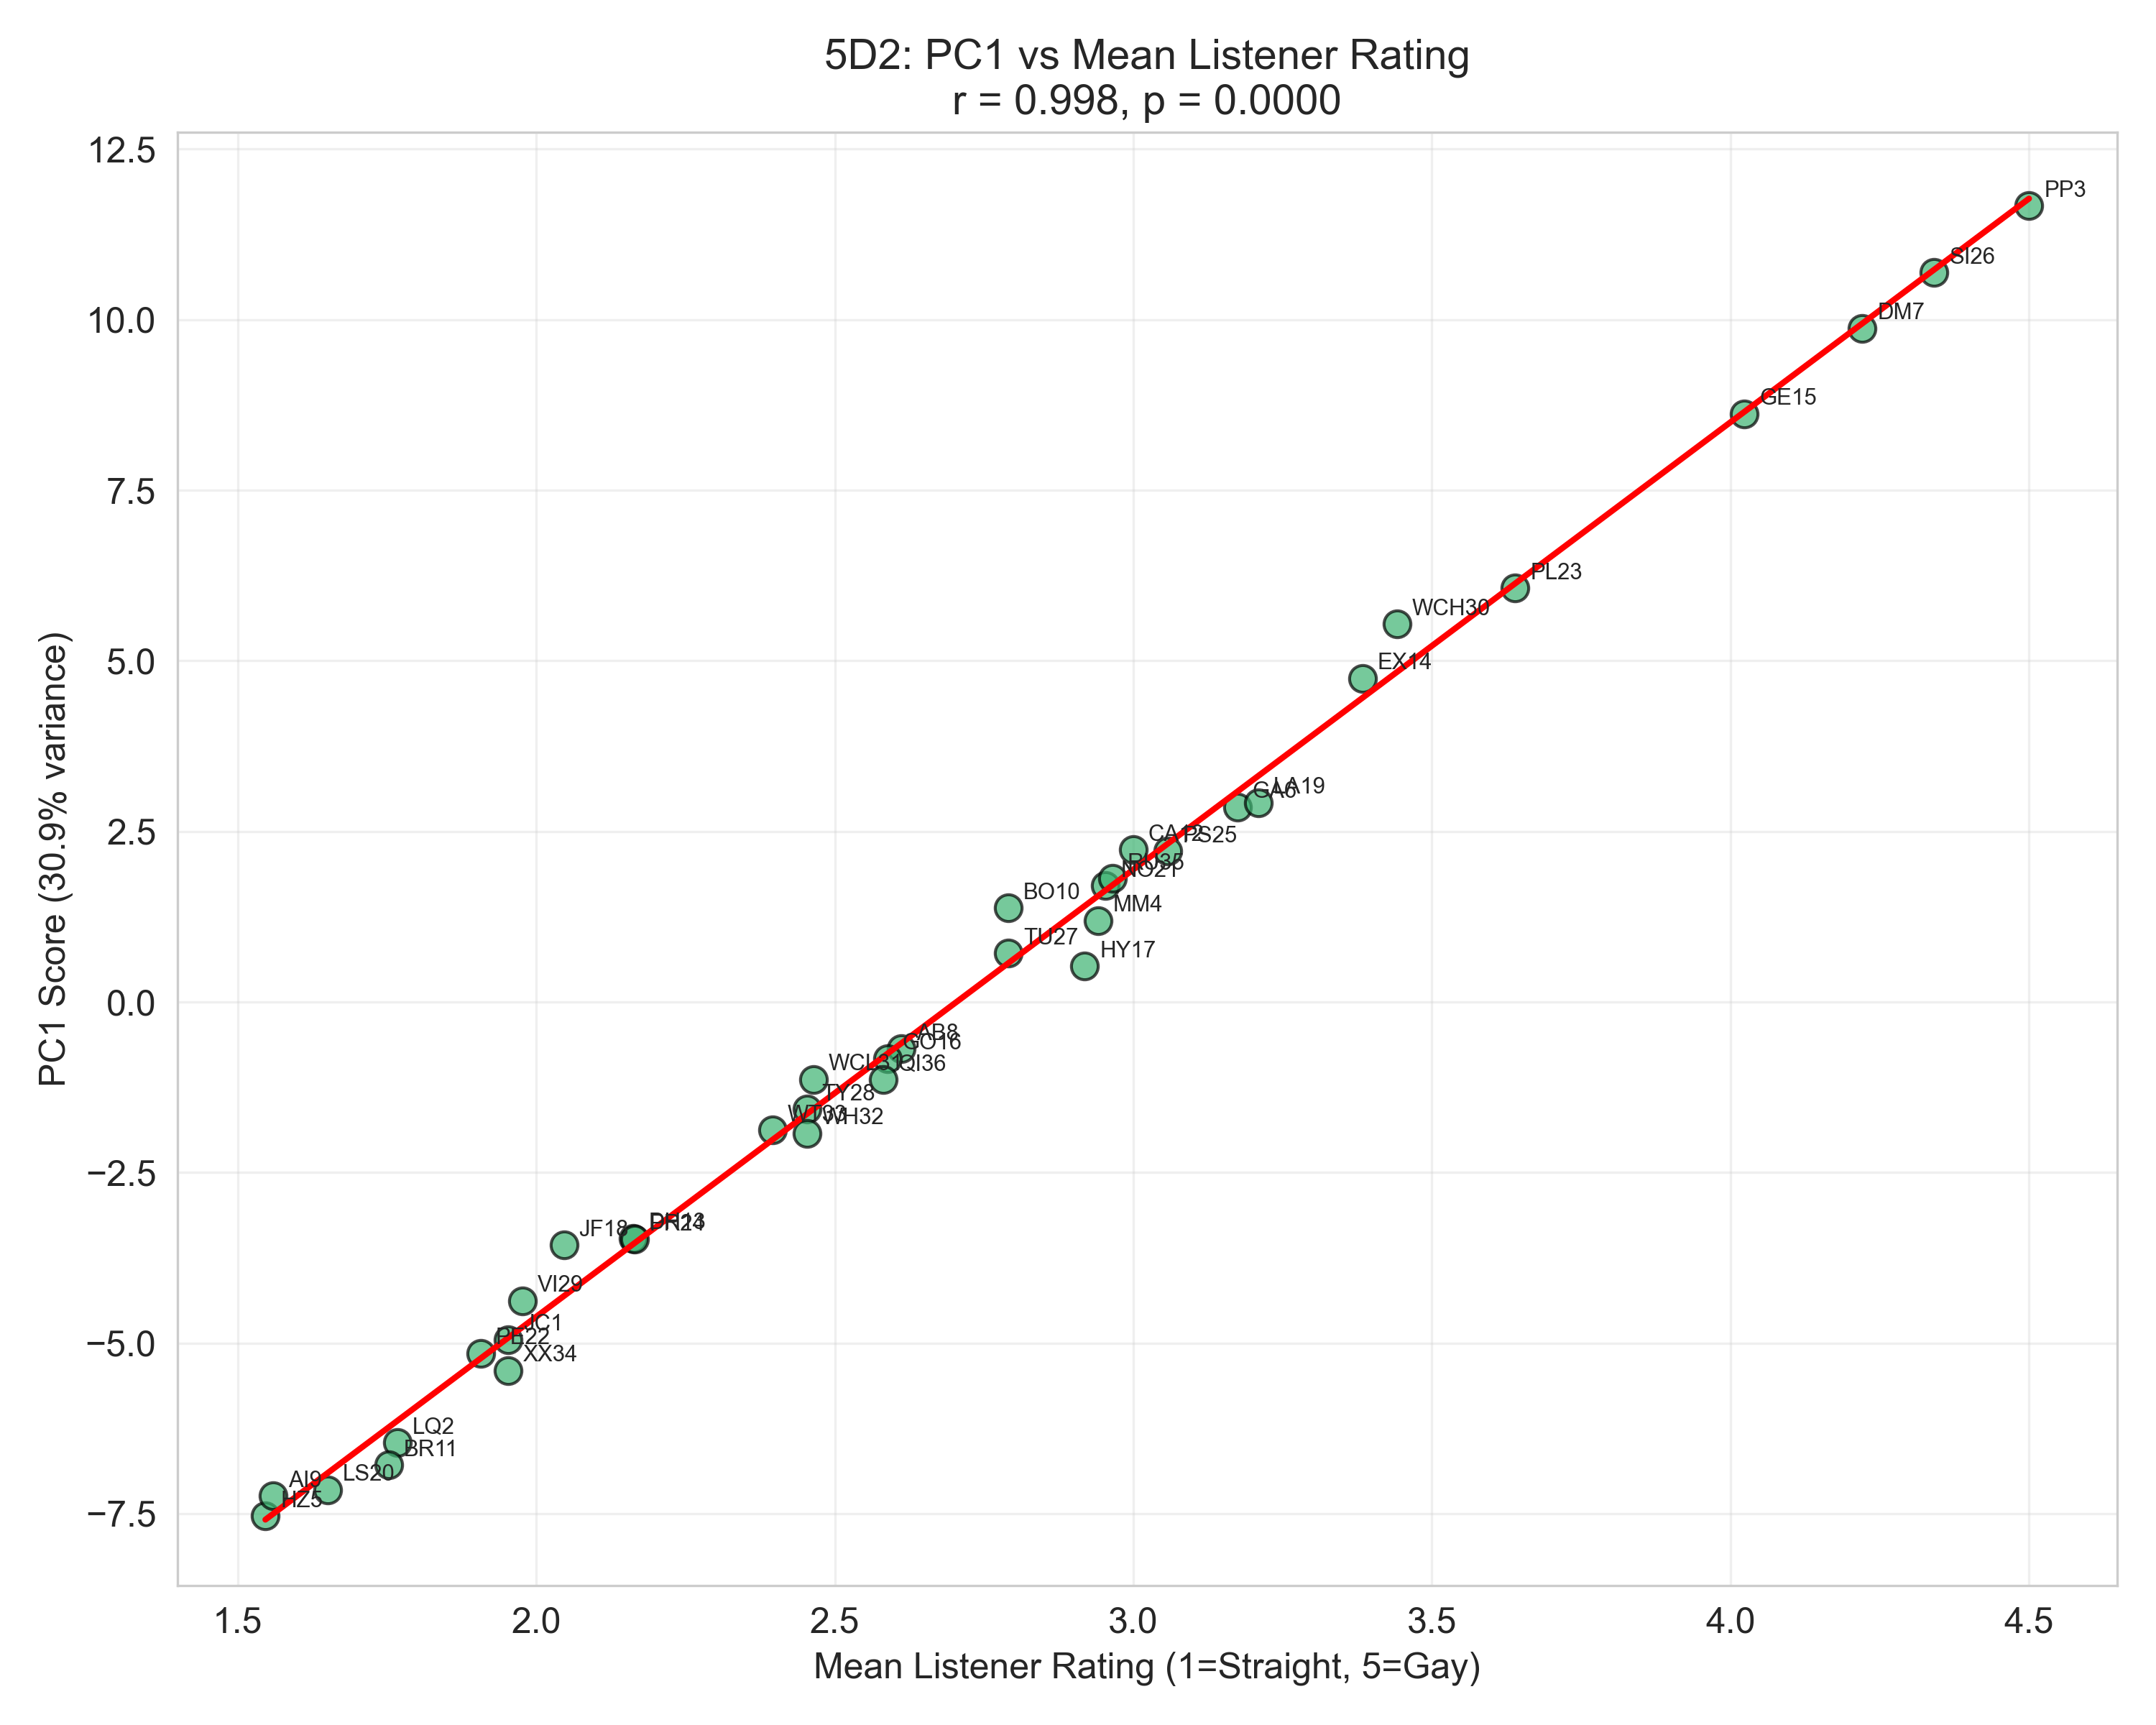
5D2 — PC1 score vs. mean listener rating per speaker.
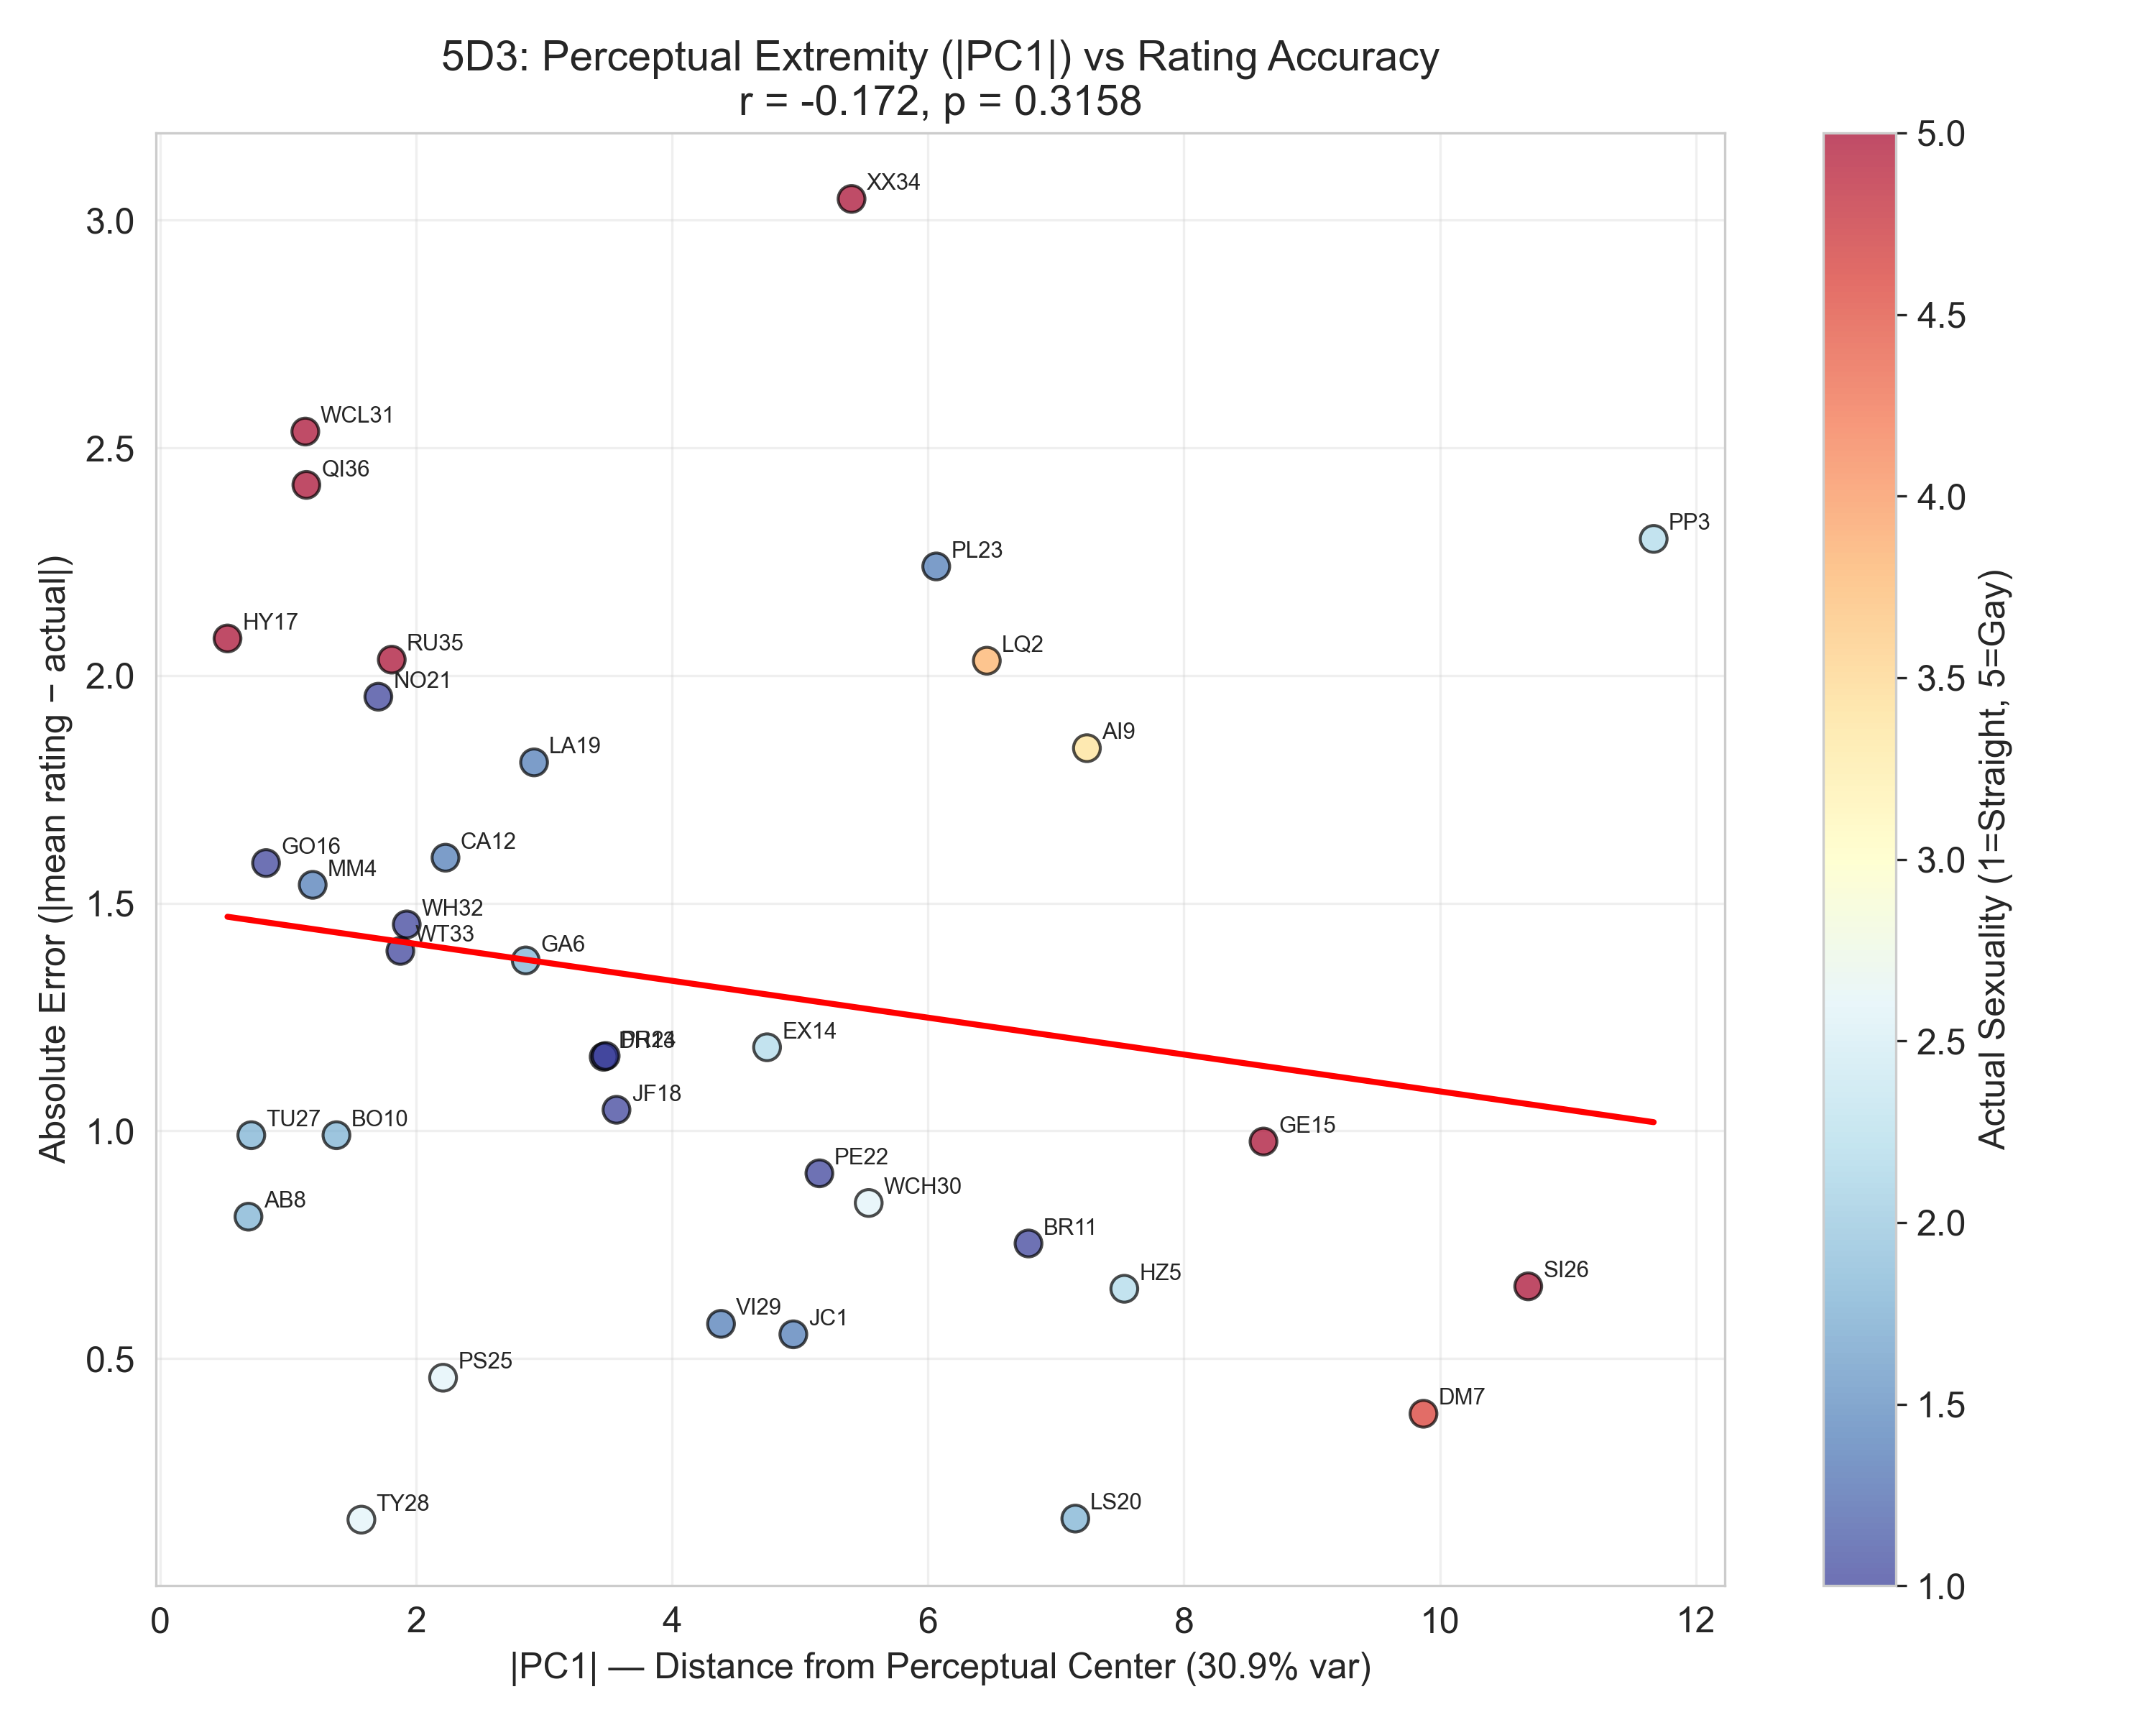
5D3 — PC1 extremity vs. prediction error.
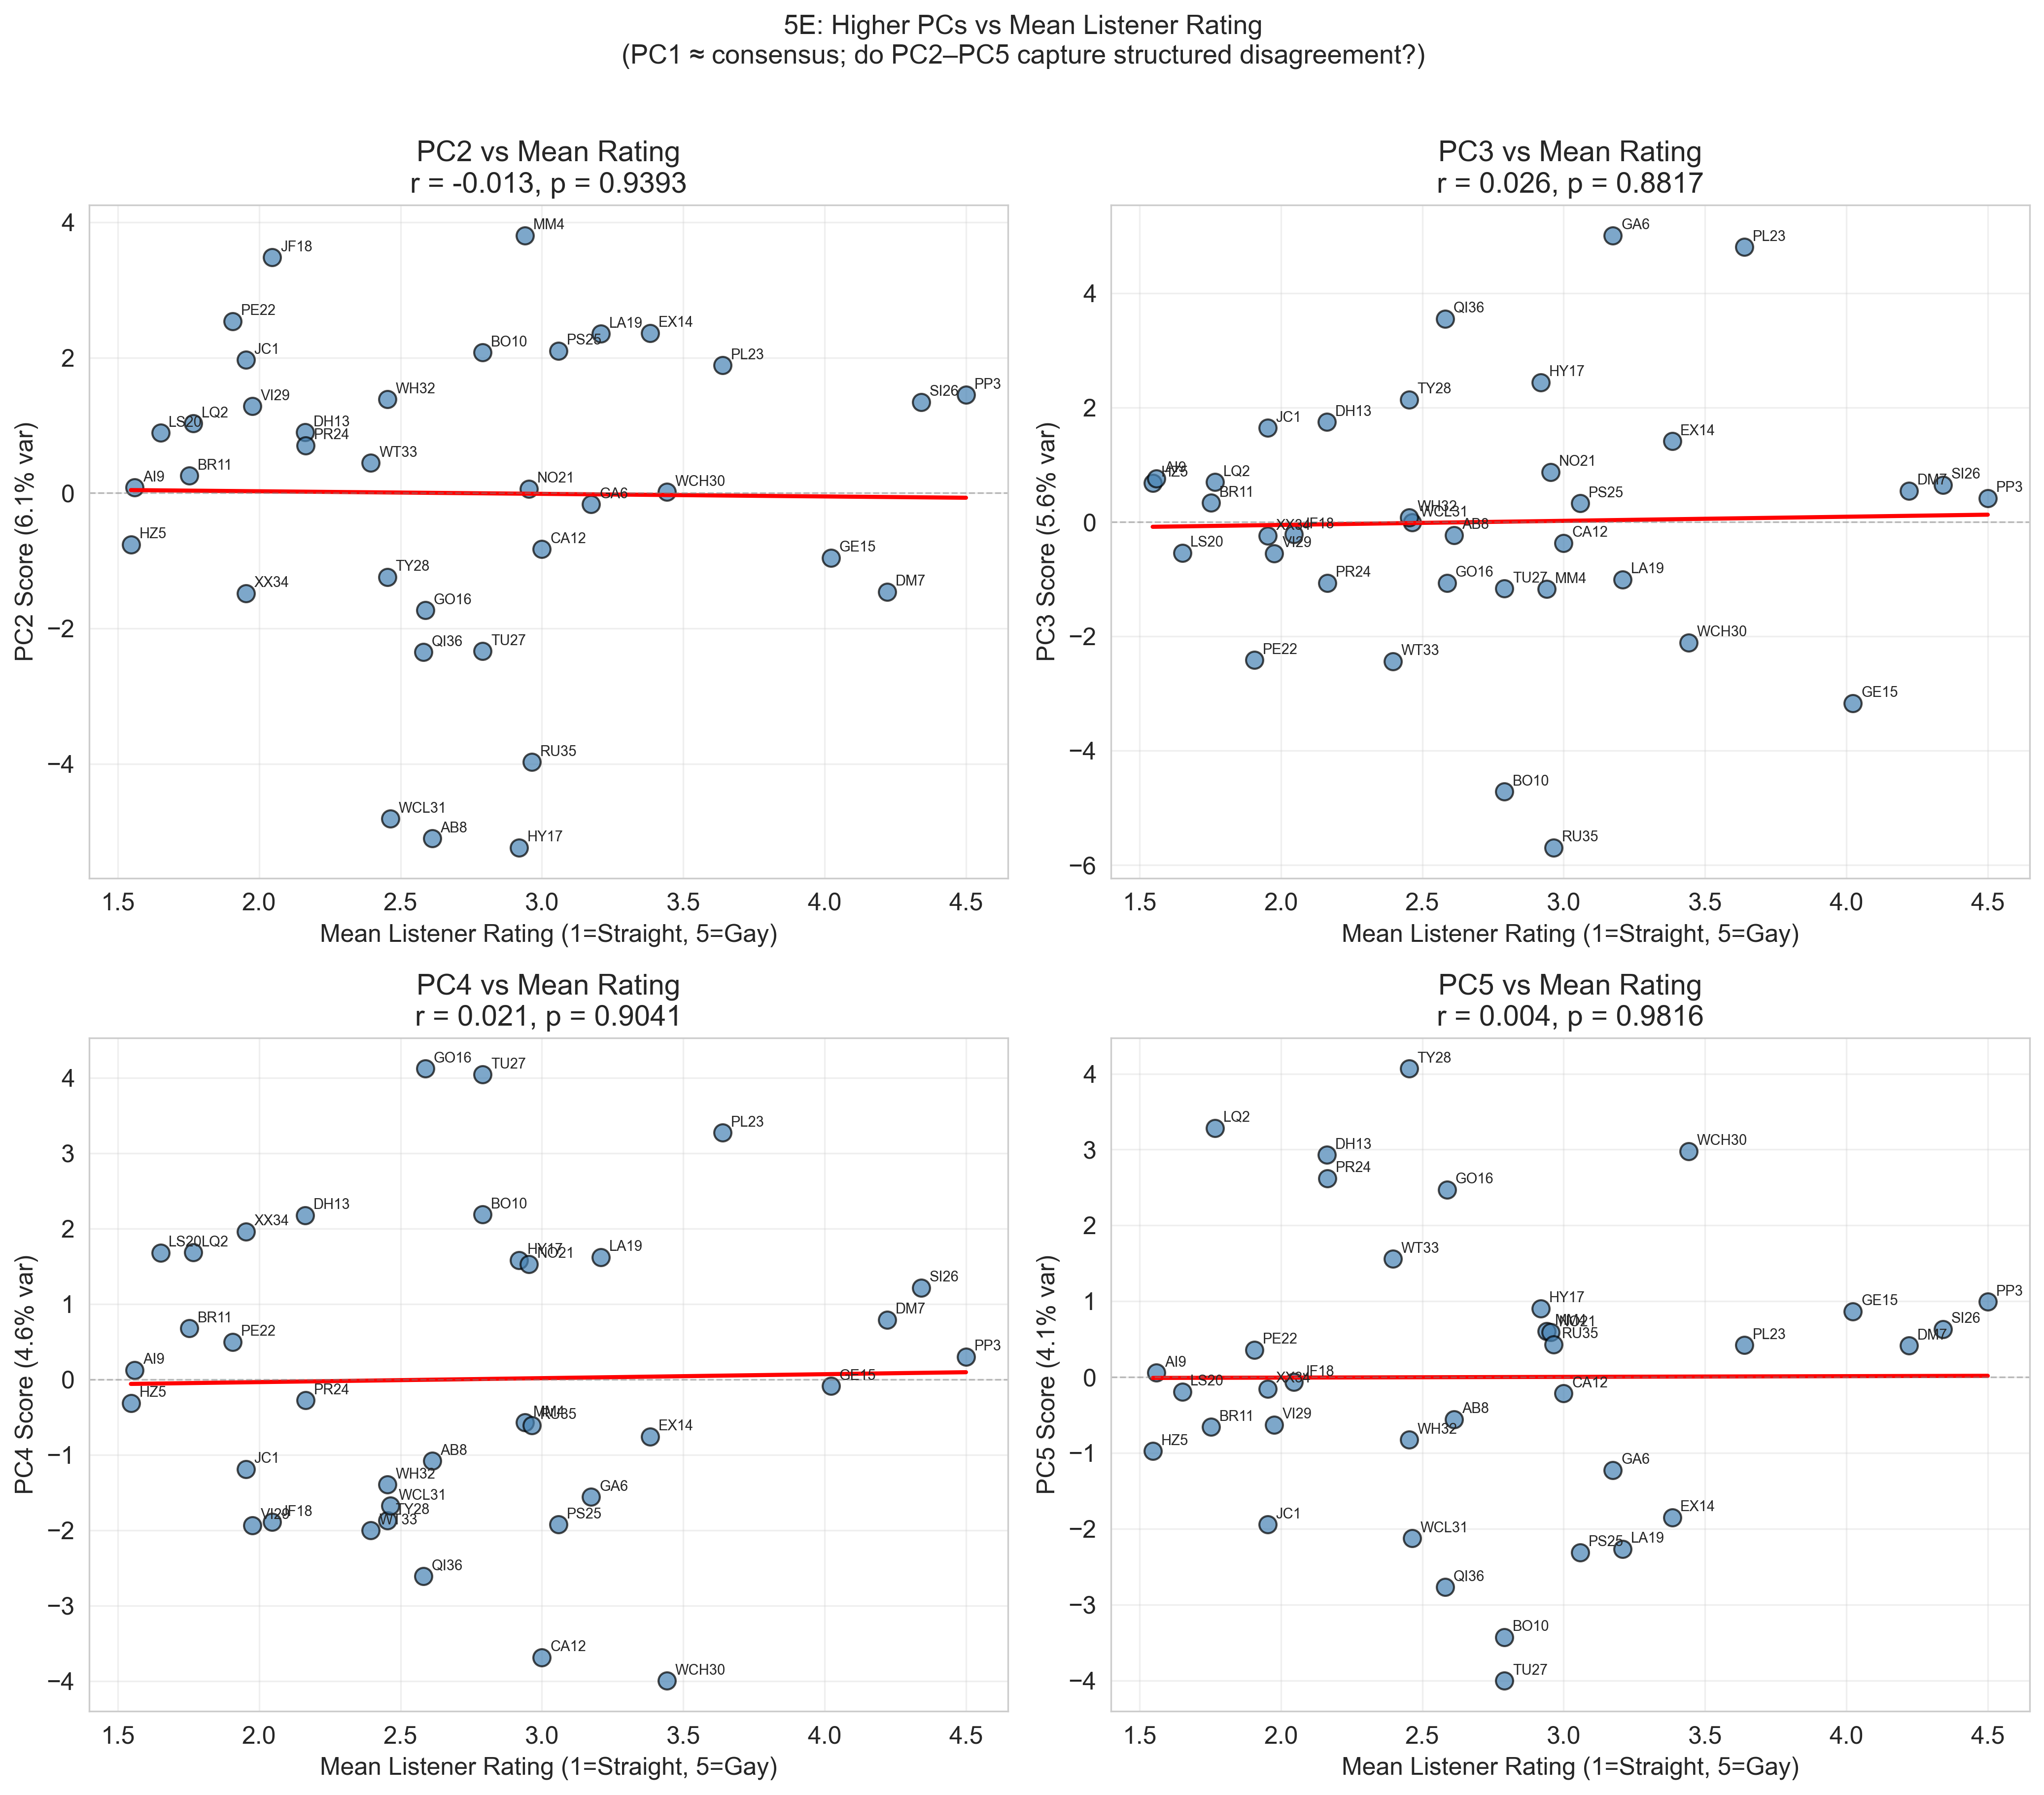
5E — Higher principal components vs. mean listener rating.
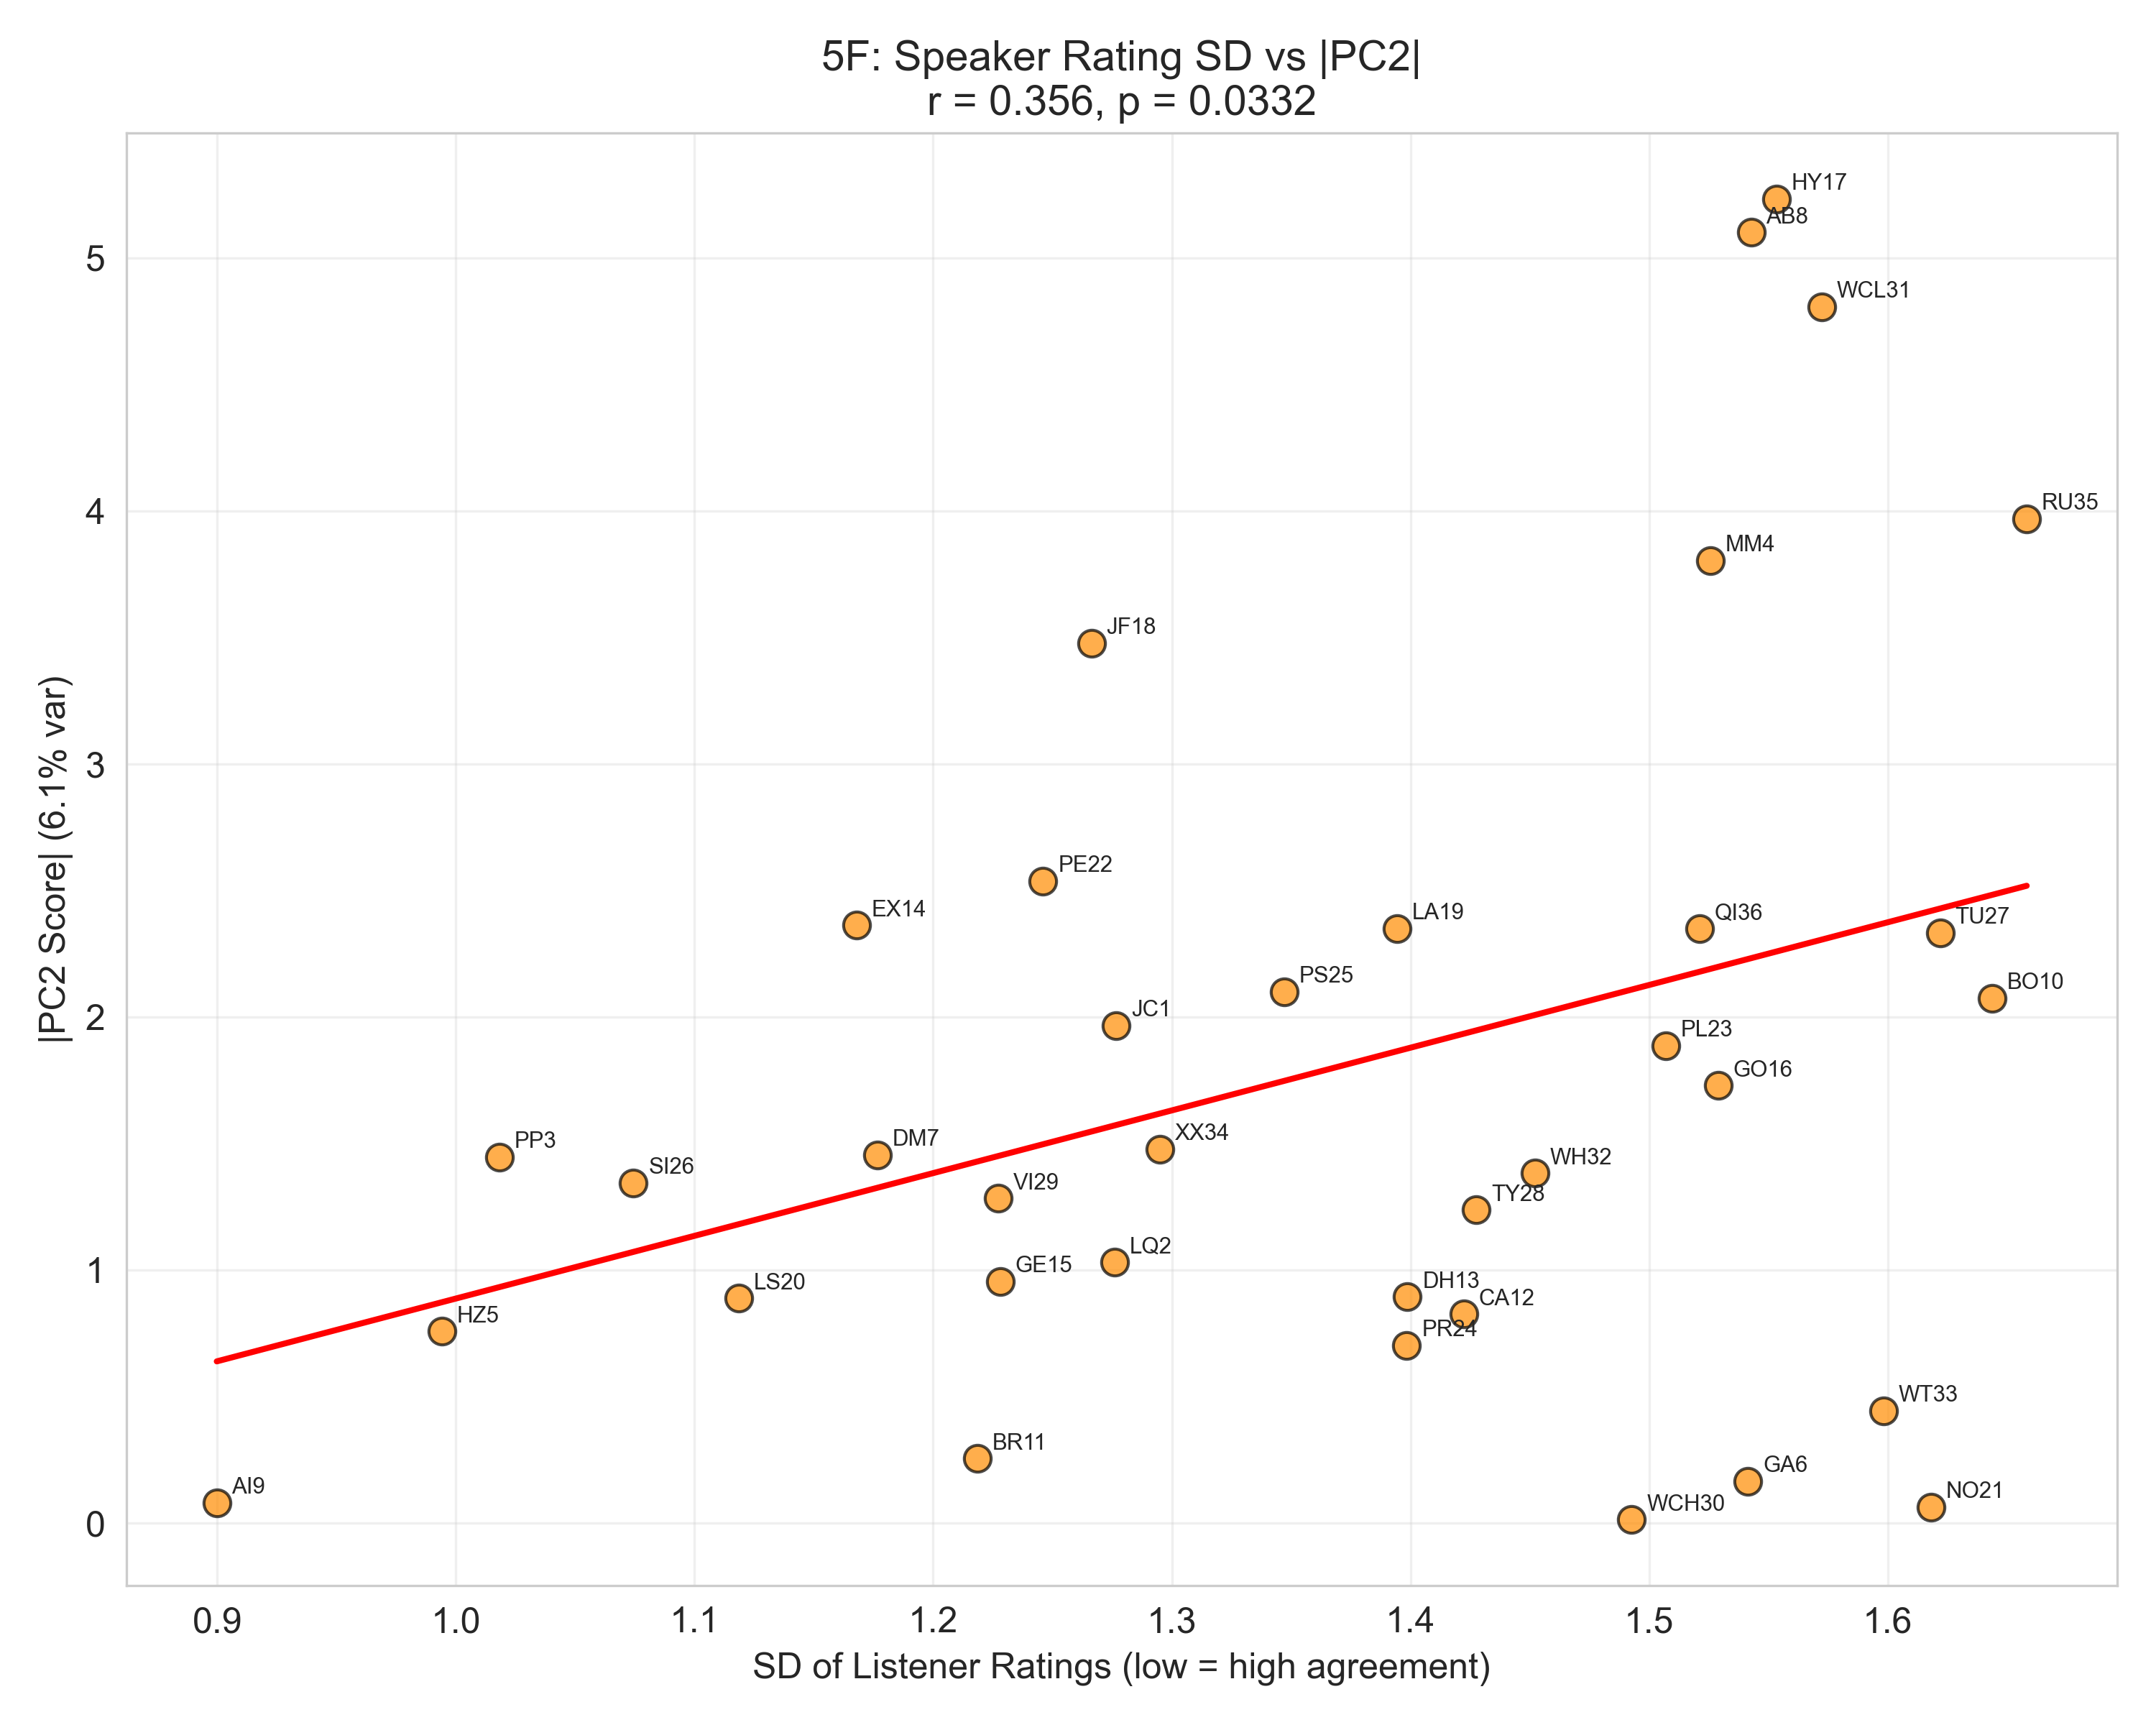
5F — Rating SD (disagreement) vs. PC2 score.
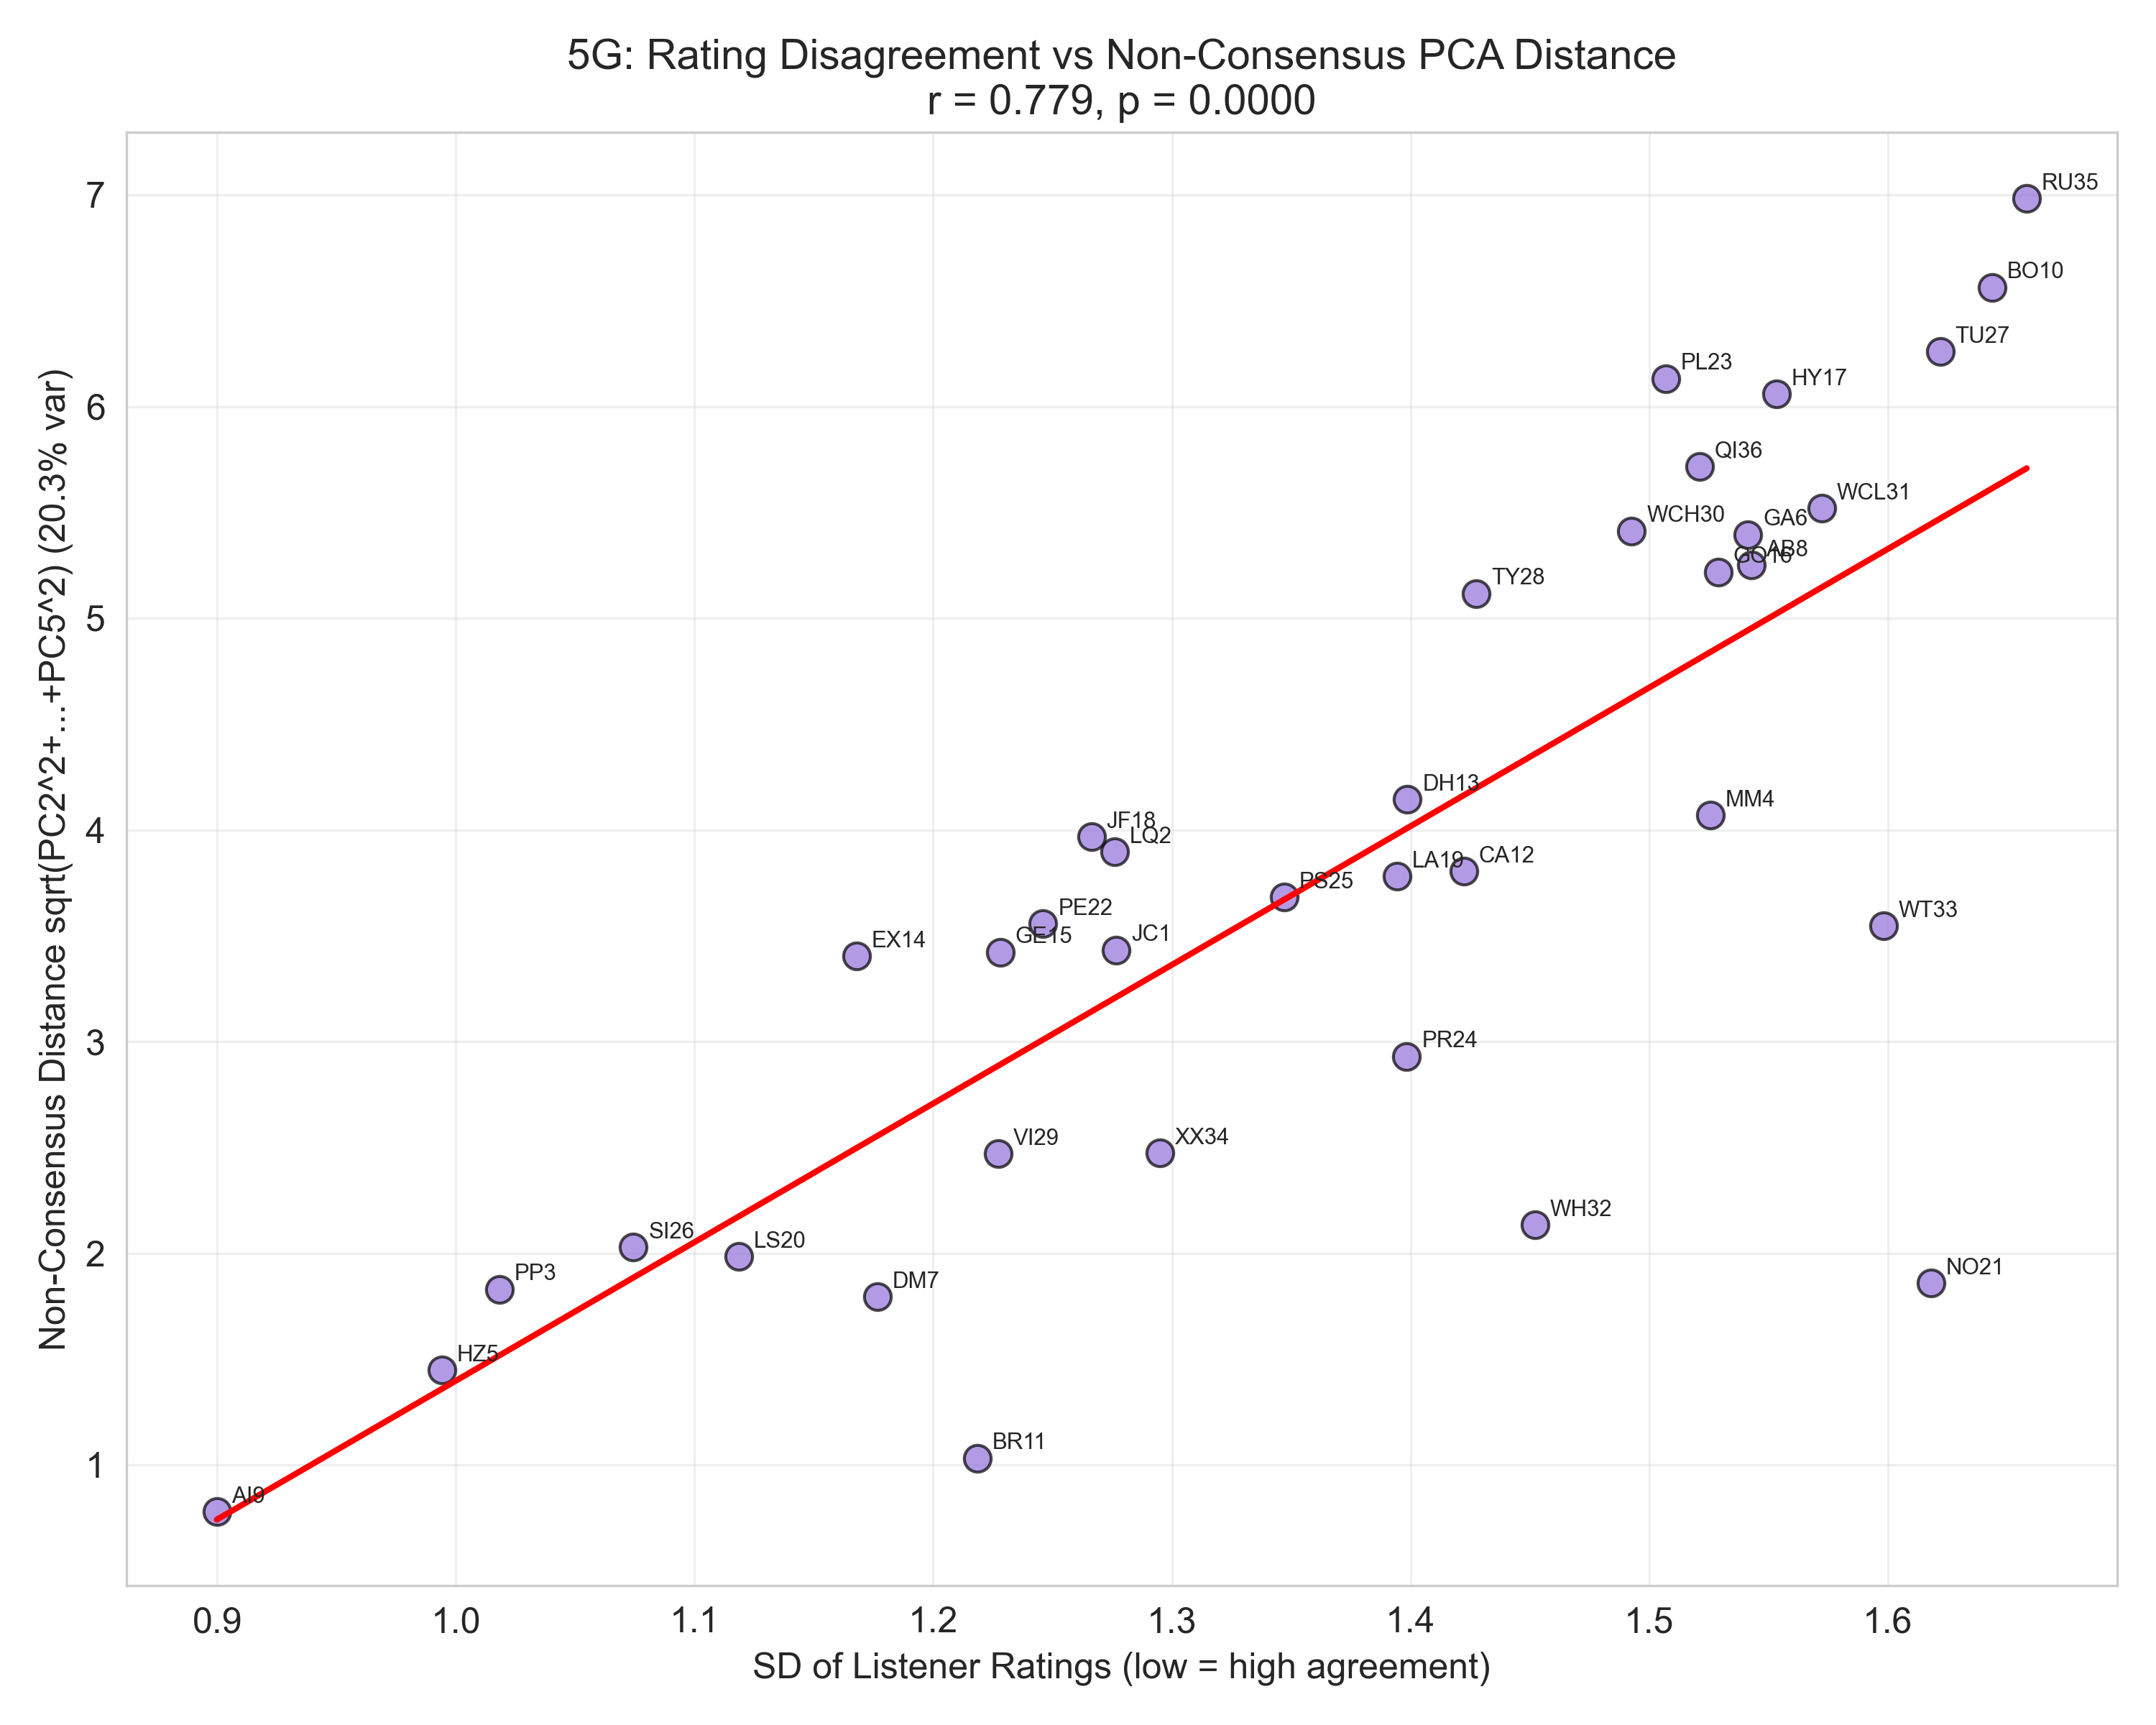
5G — Rating SD vs. non-consensus distance.
Section 6: Listener Response Bias
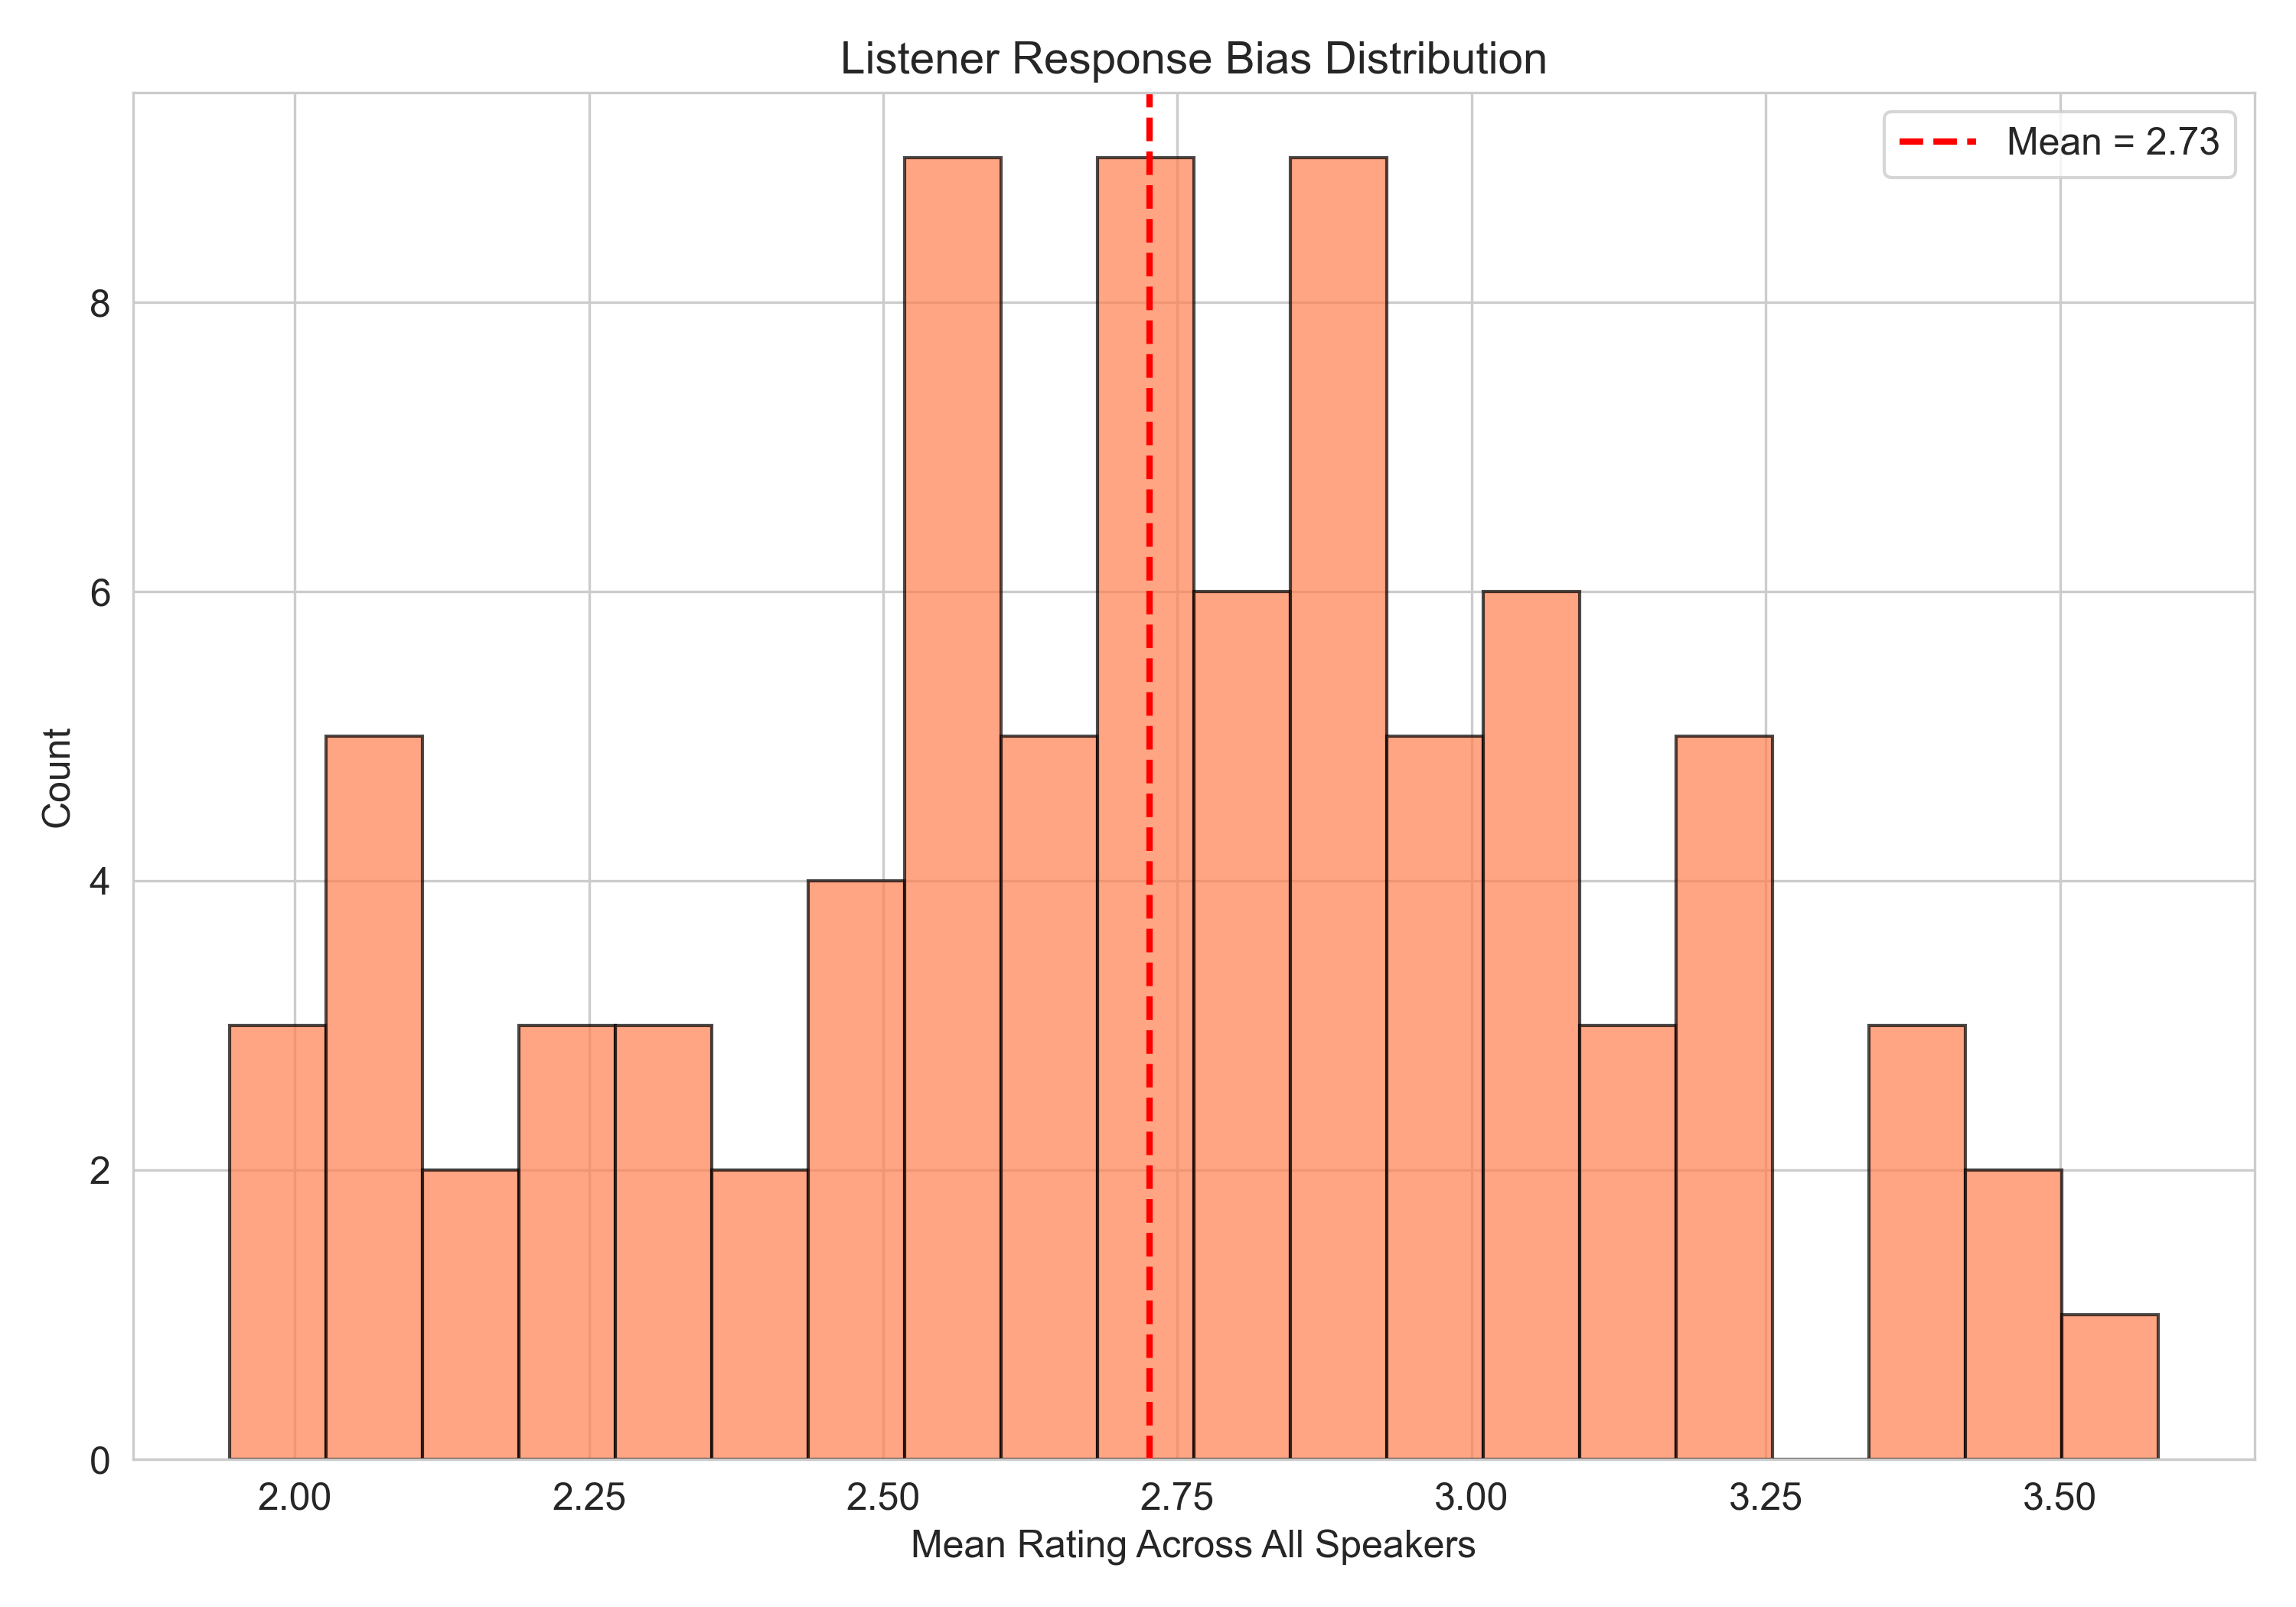
6A — Distribution of per-listener mean ratings across all speakers. Mean = 2.73.
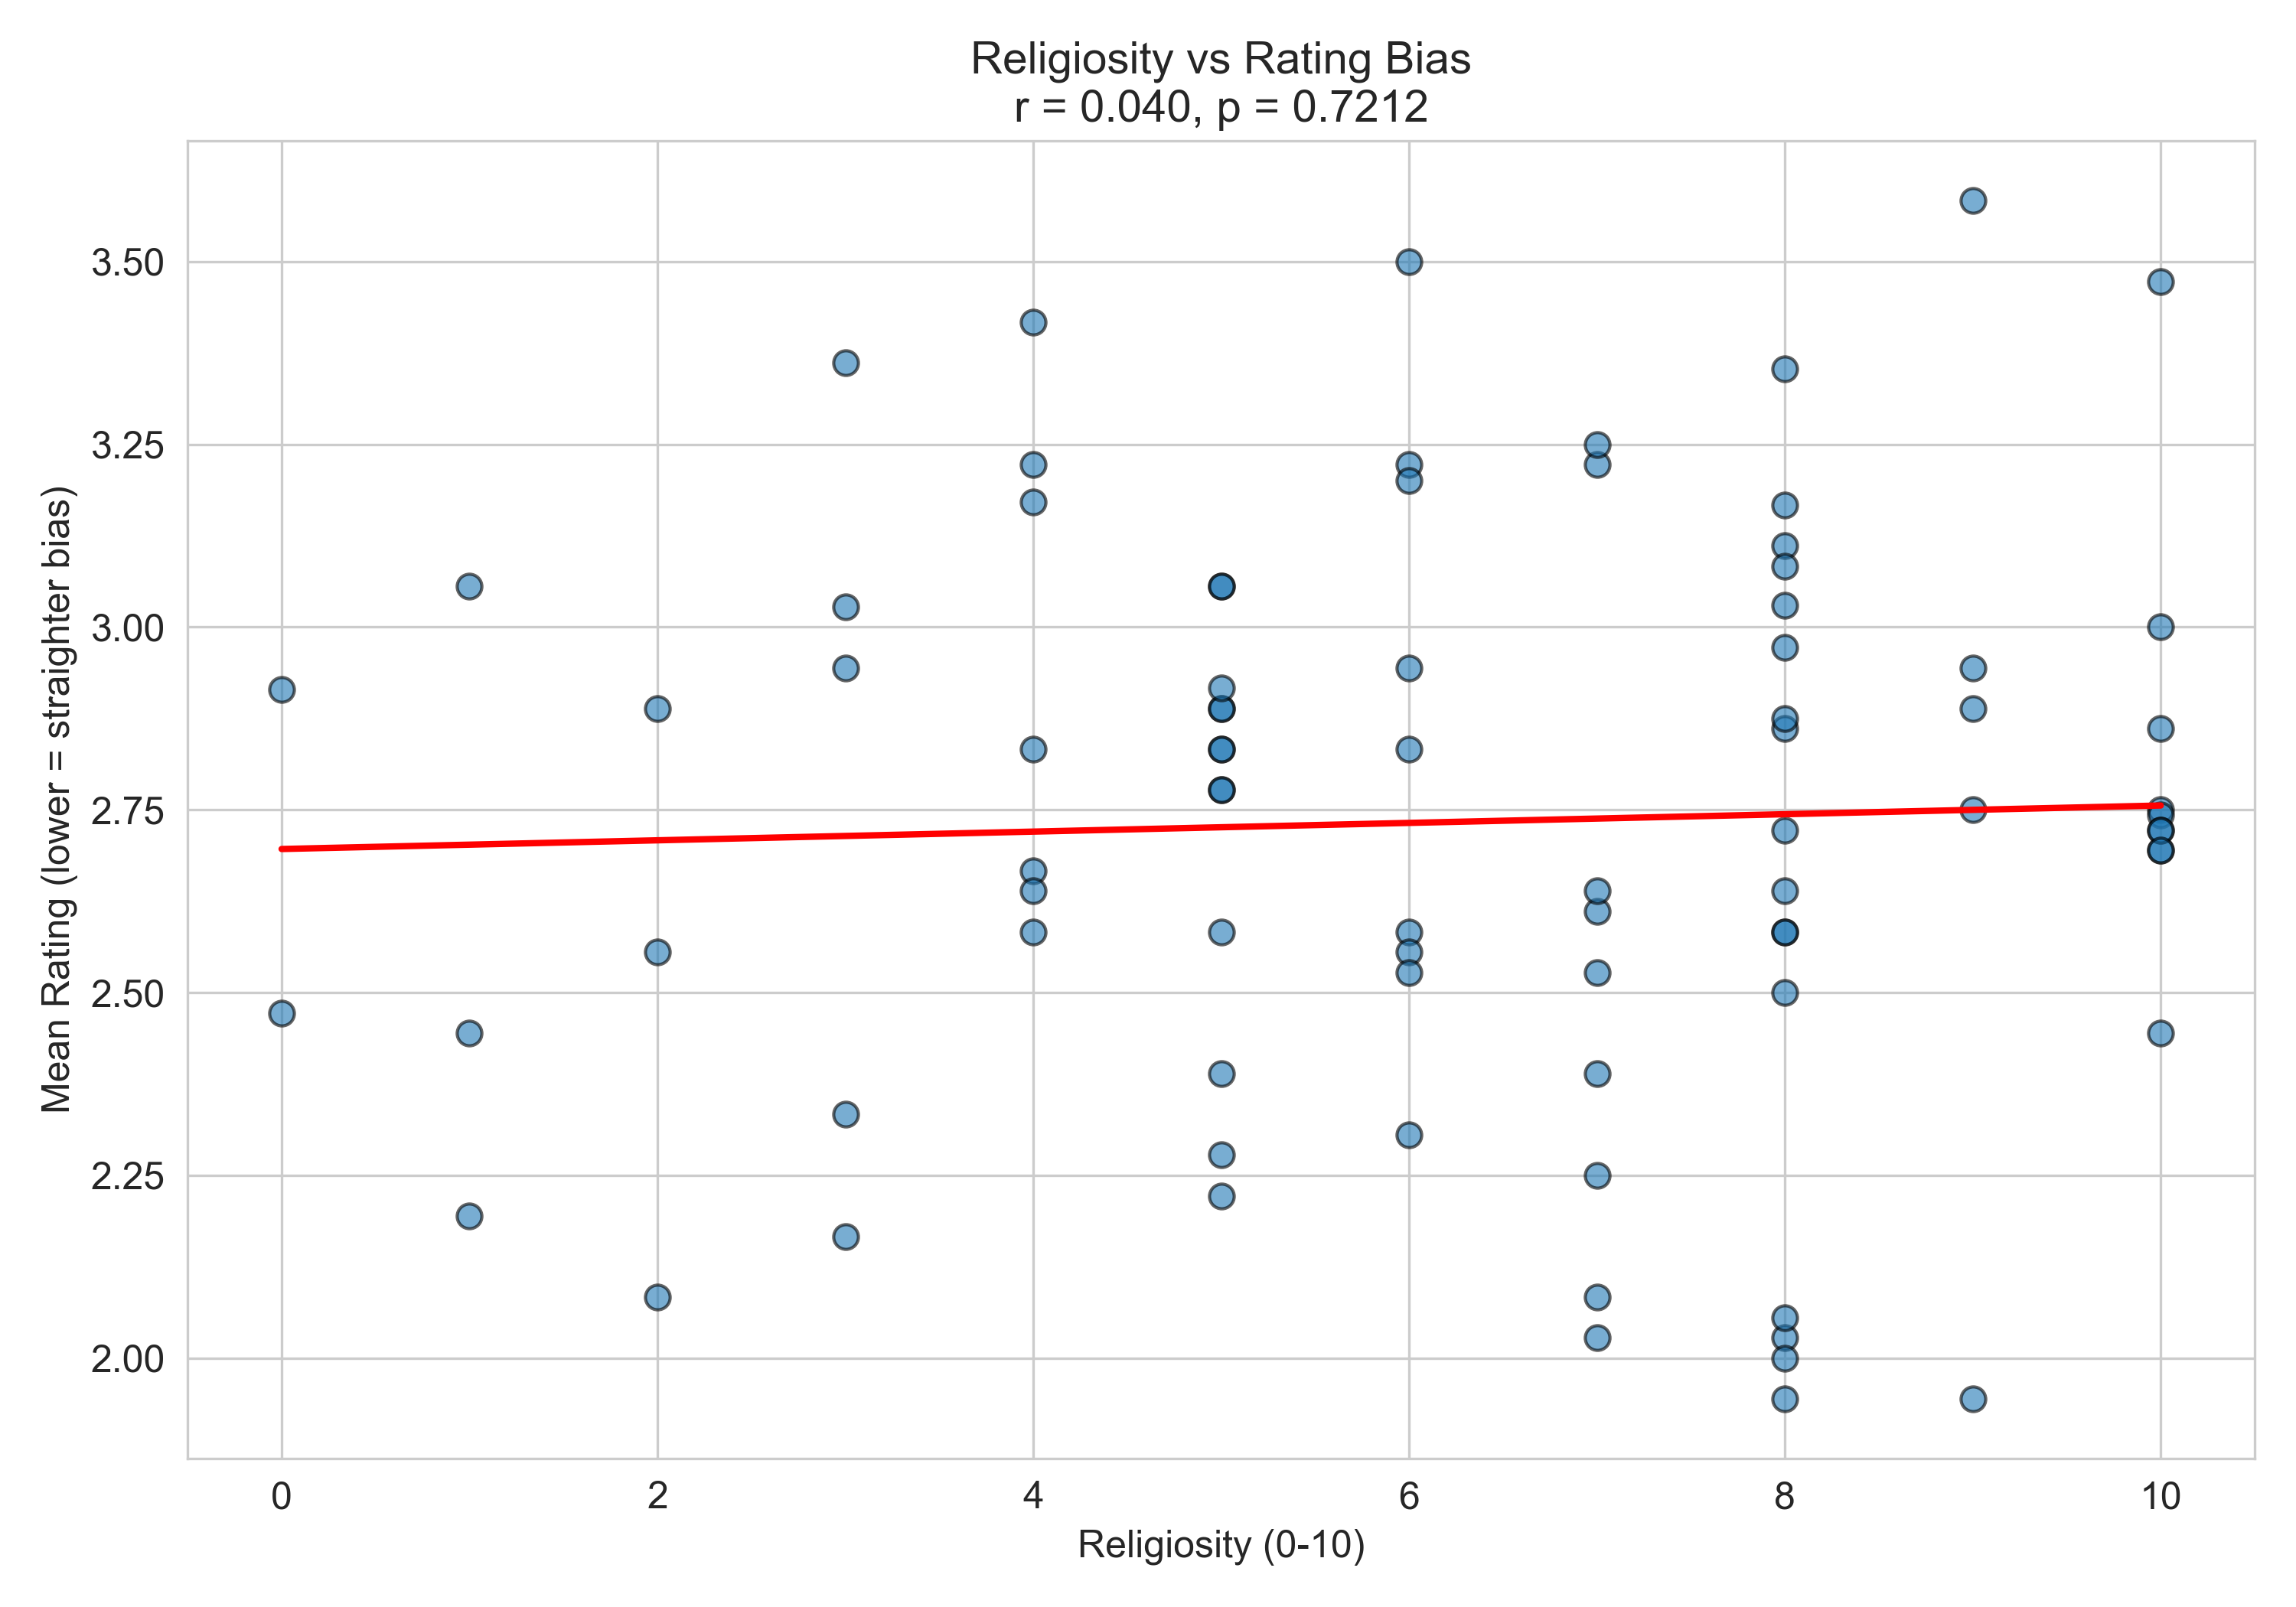
6B — Listener religiosity vs. rating bias. r = 0.040, p = 0.721.
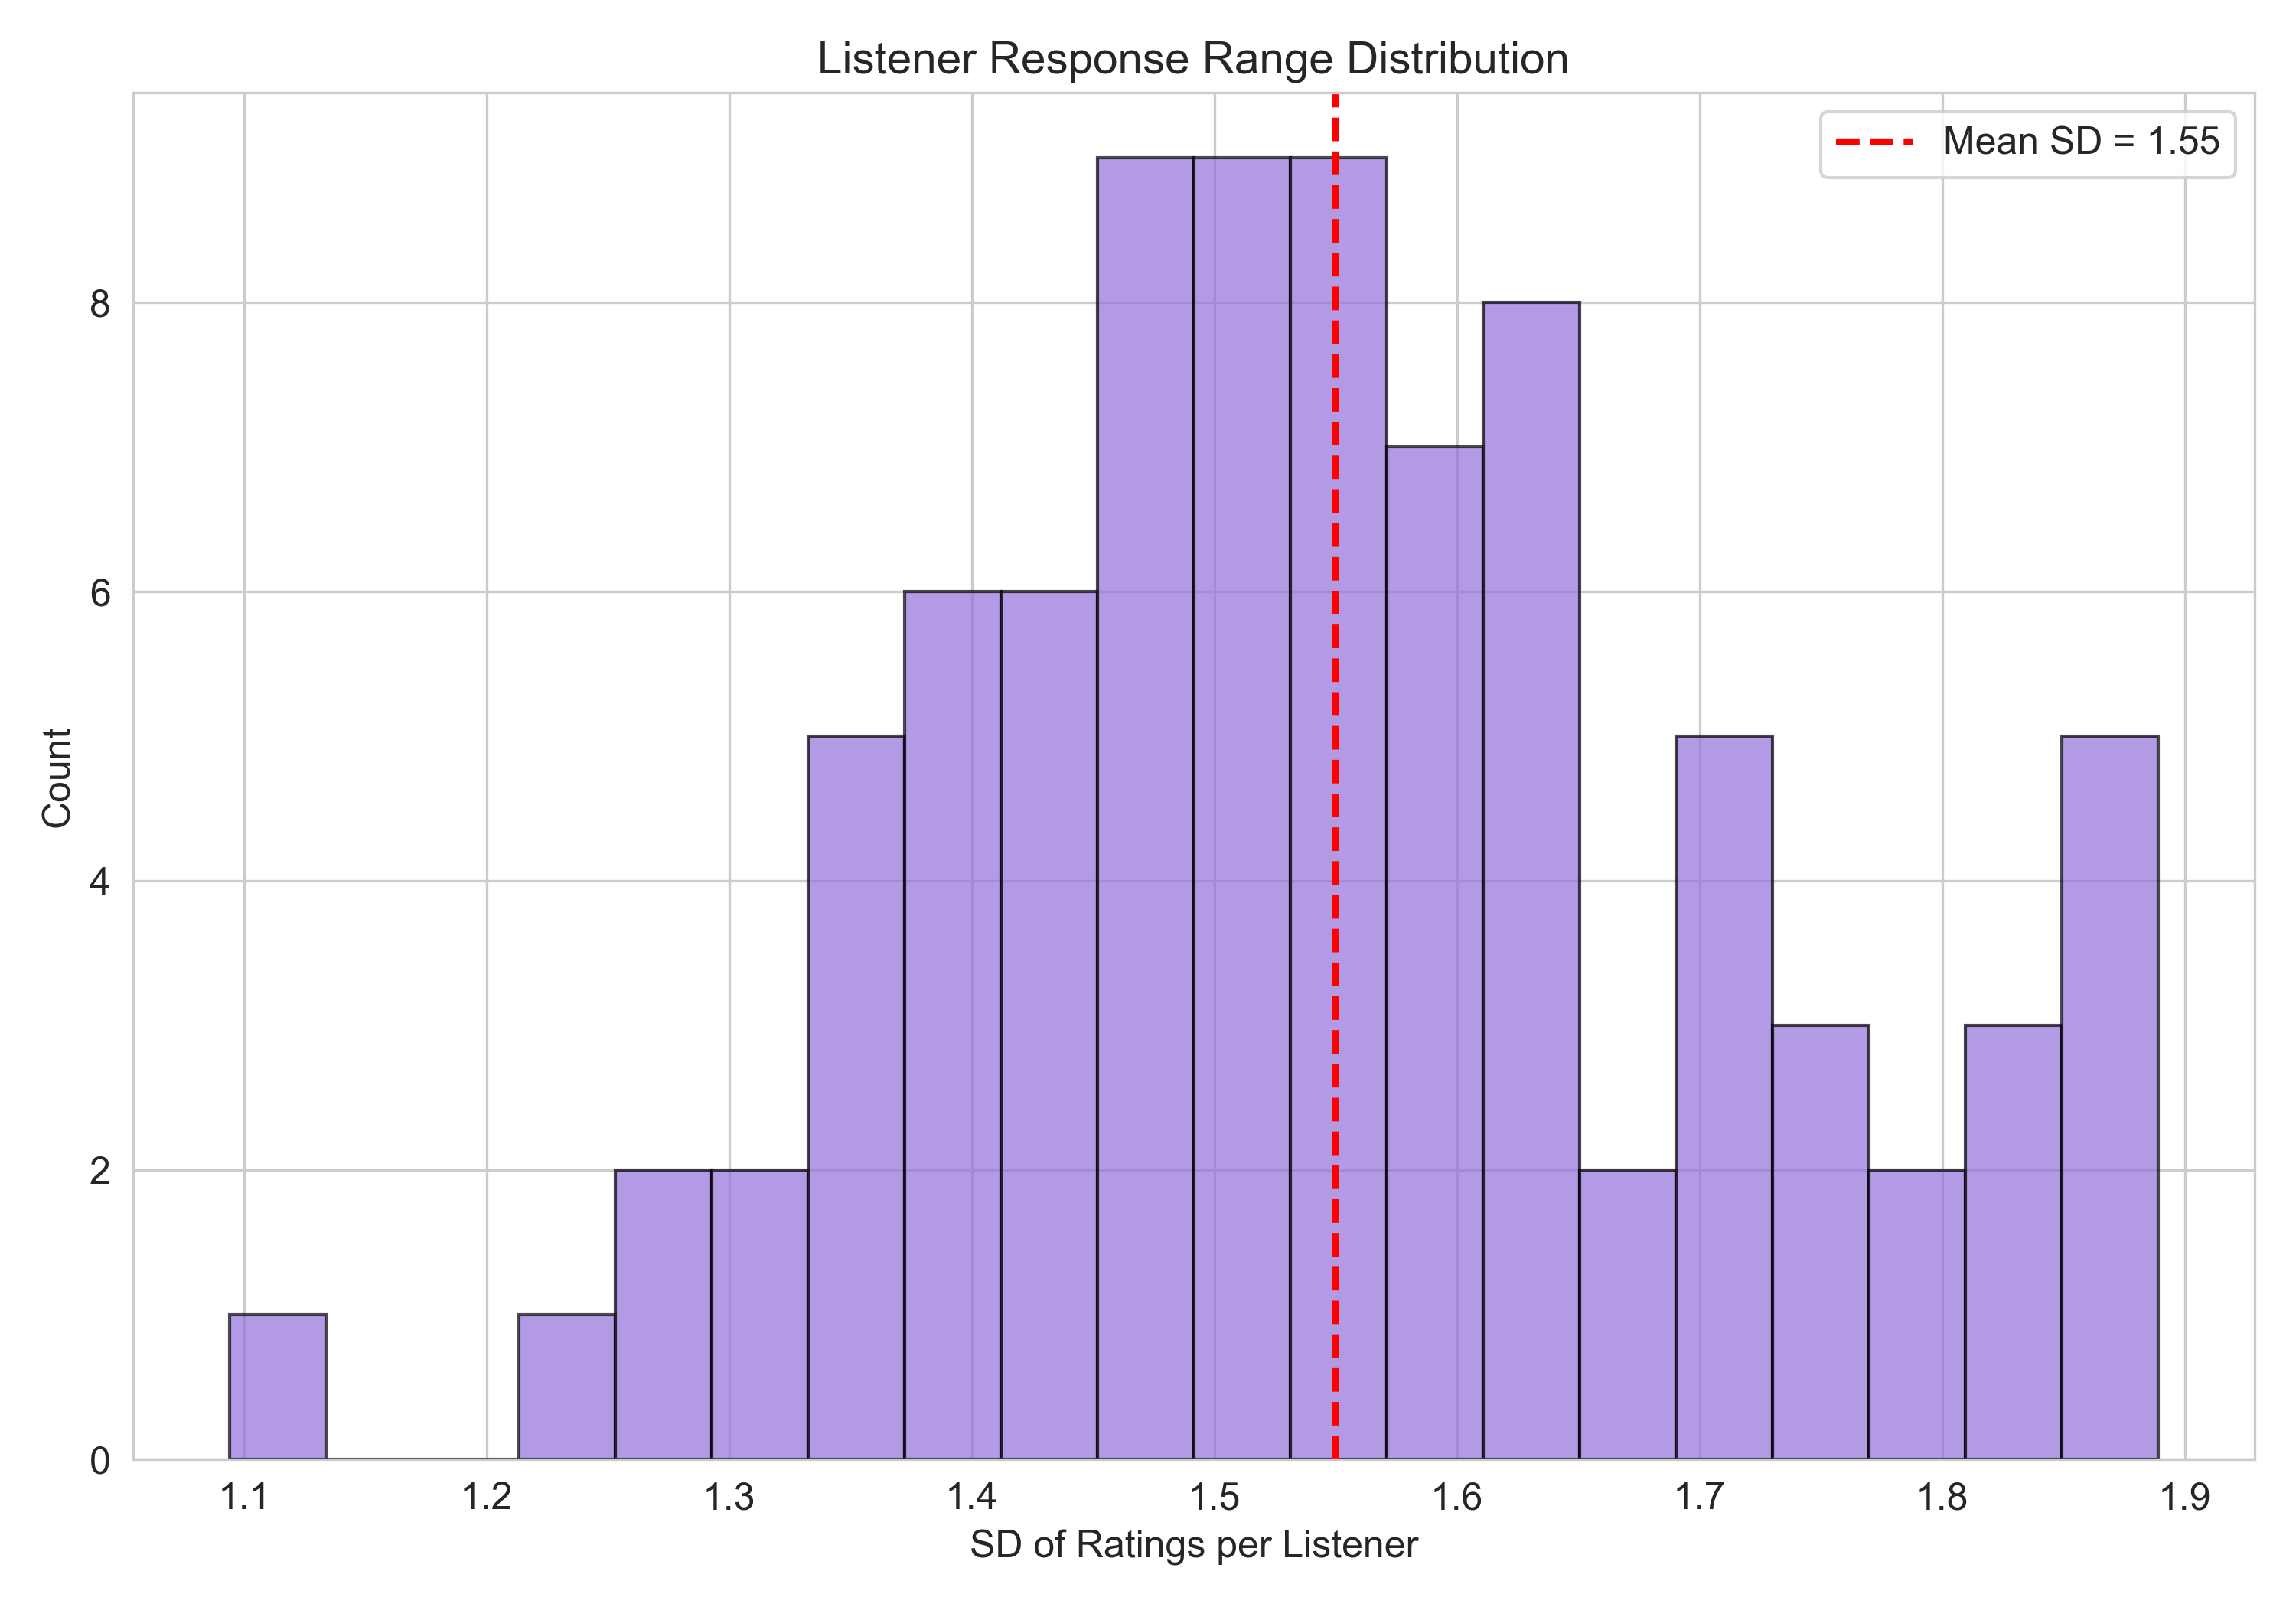
6C — Distribution of per-listener rating range (max − min across speakers).
Section 7: Group Interactions
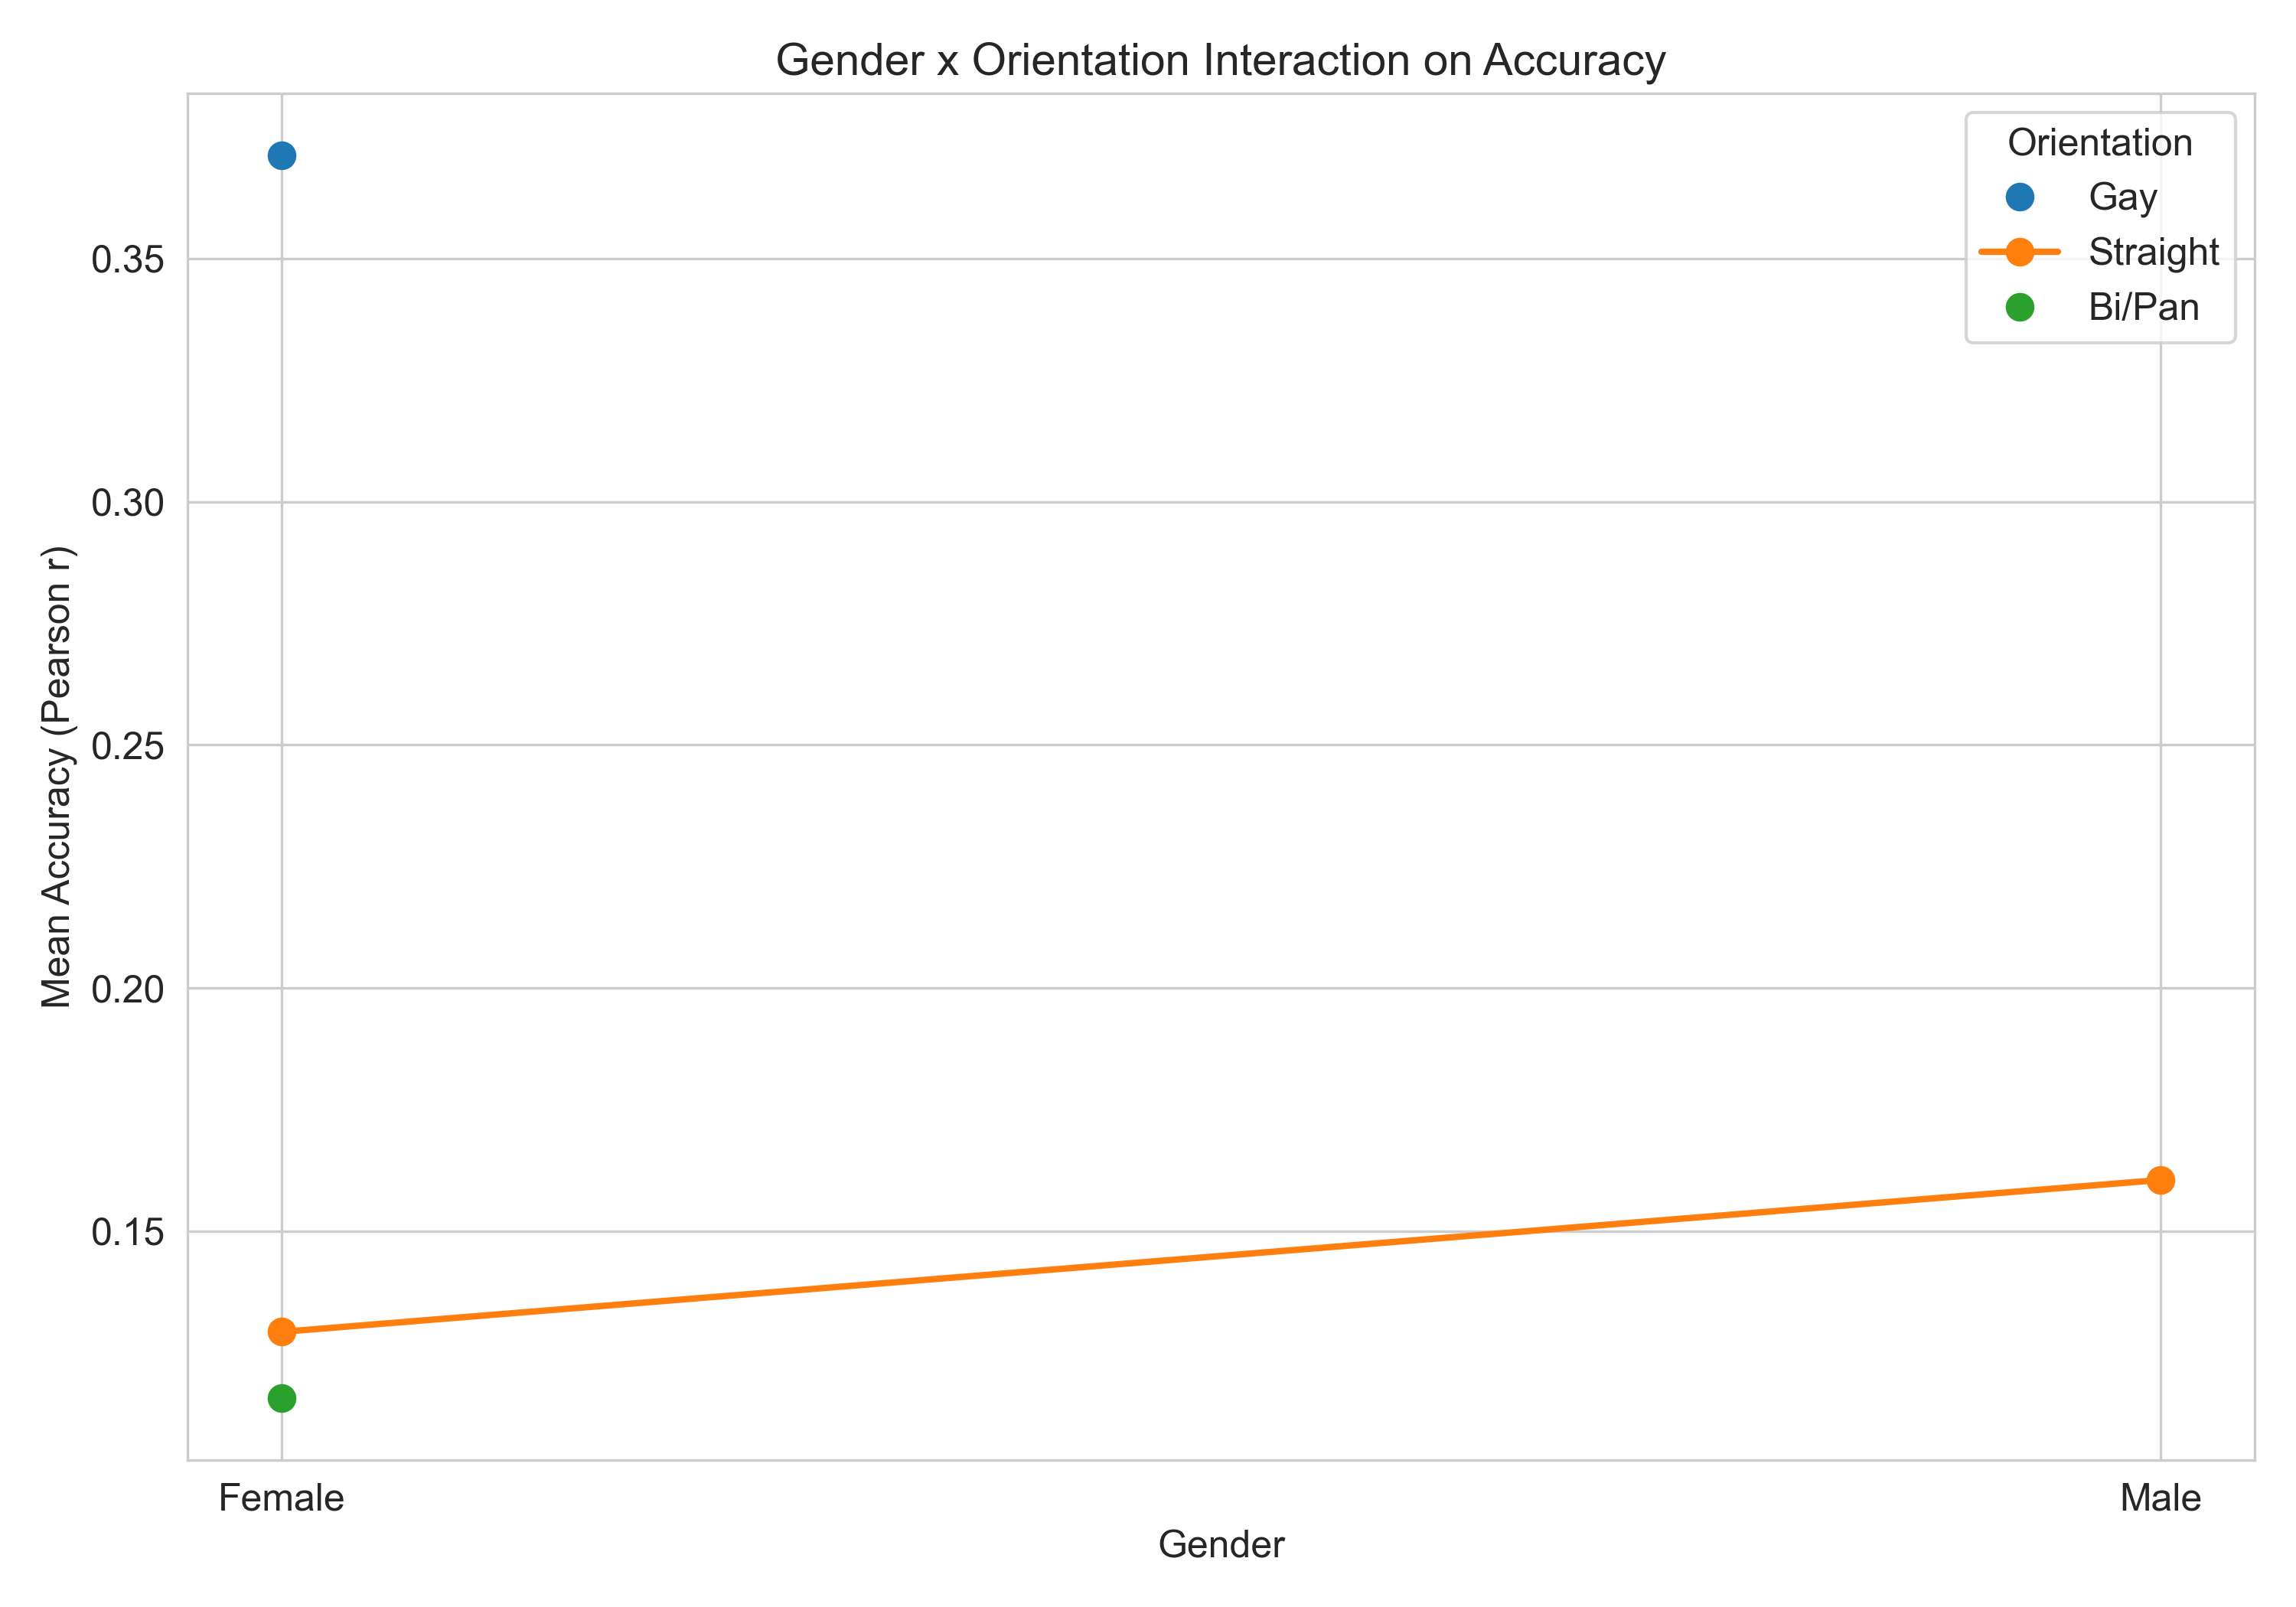
7A — Gender × orientation interaction on perception accuracy.
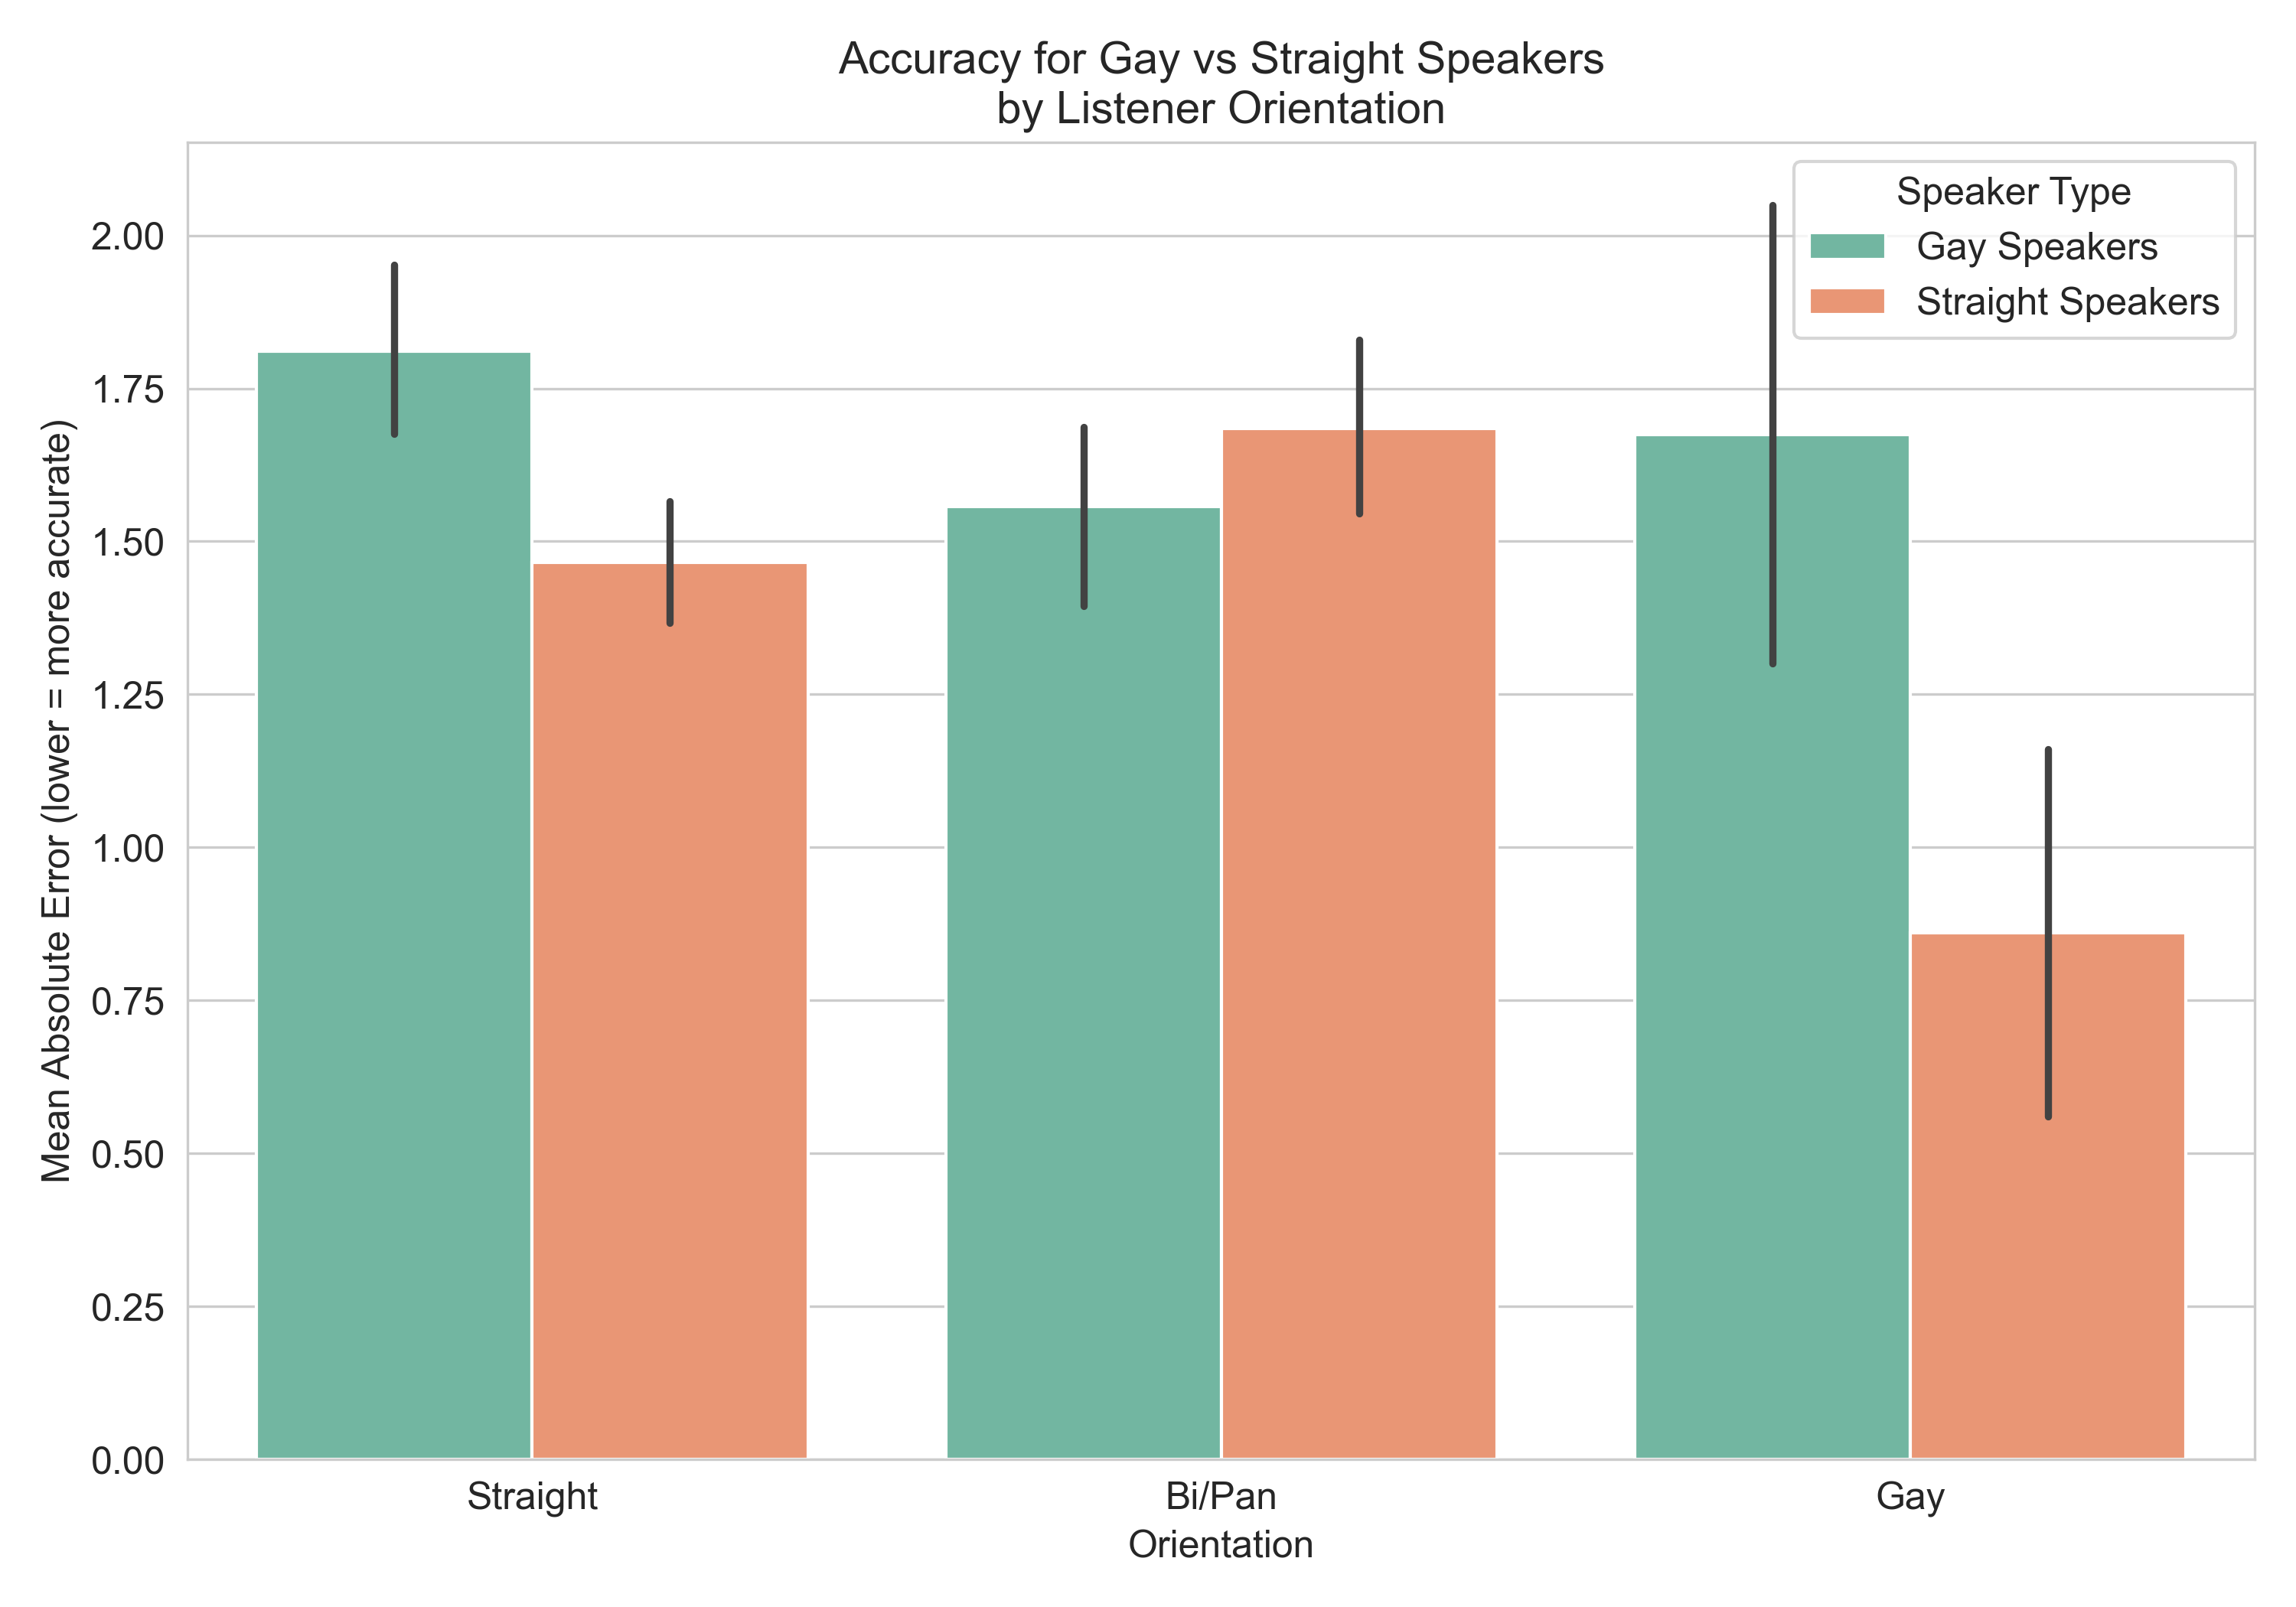
7B — Match effects: accuracy when listener and speaker share orientation vs. not.
Section 8: Signal Detection Theory
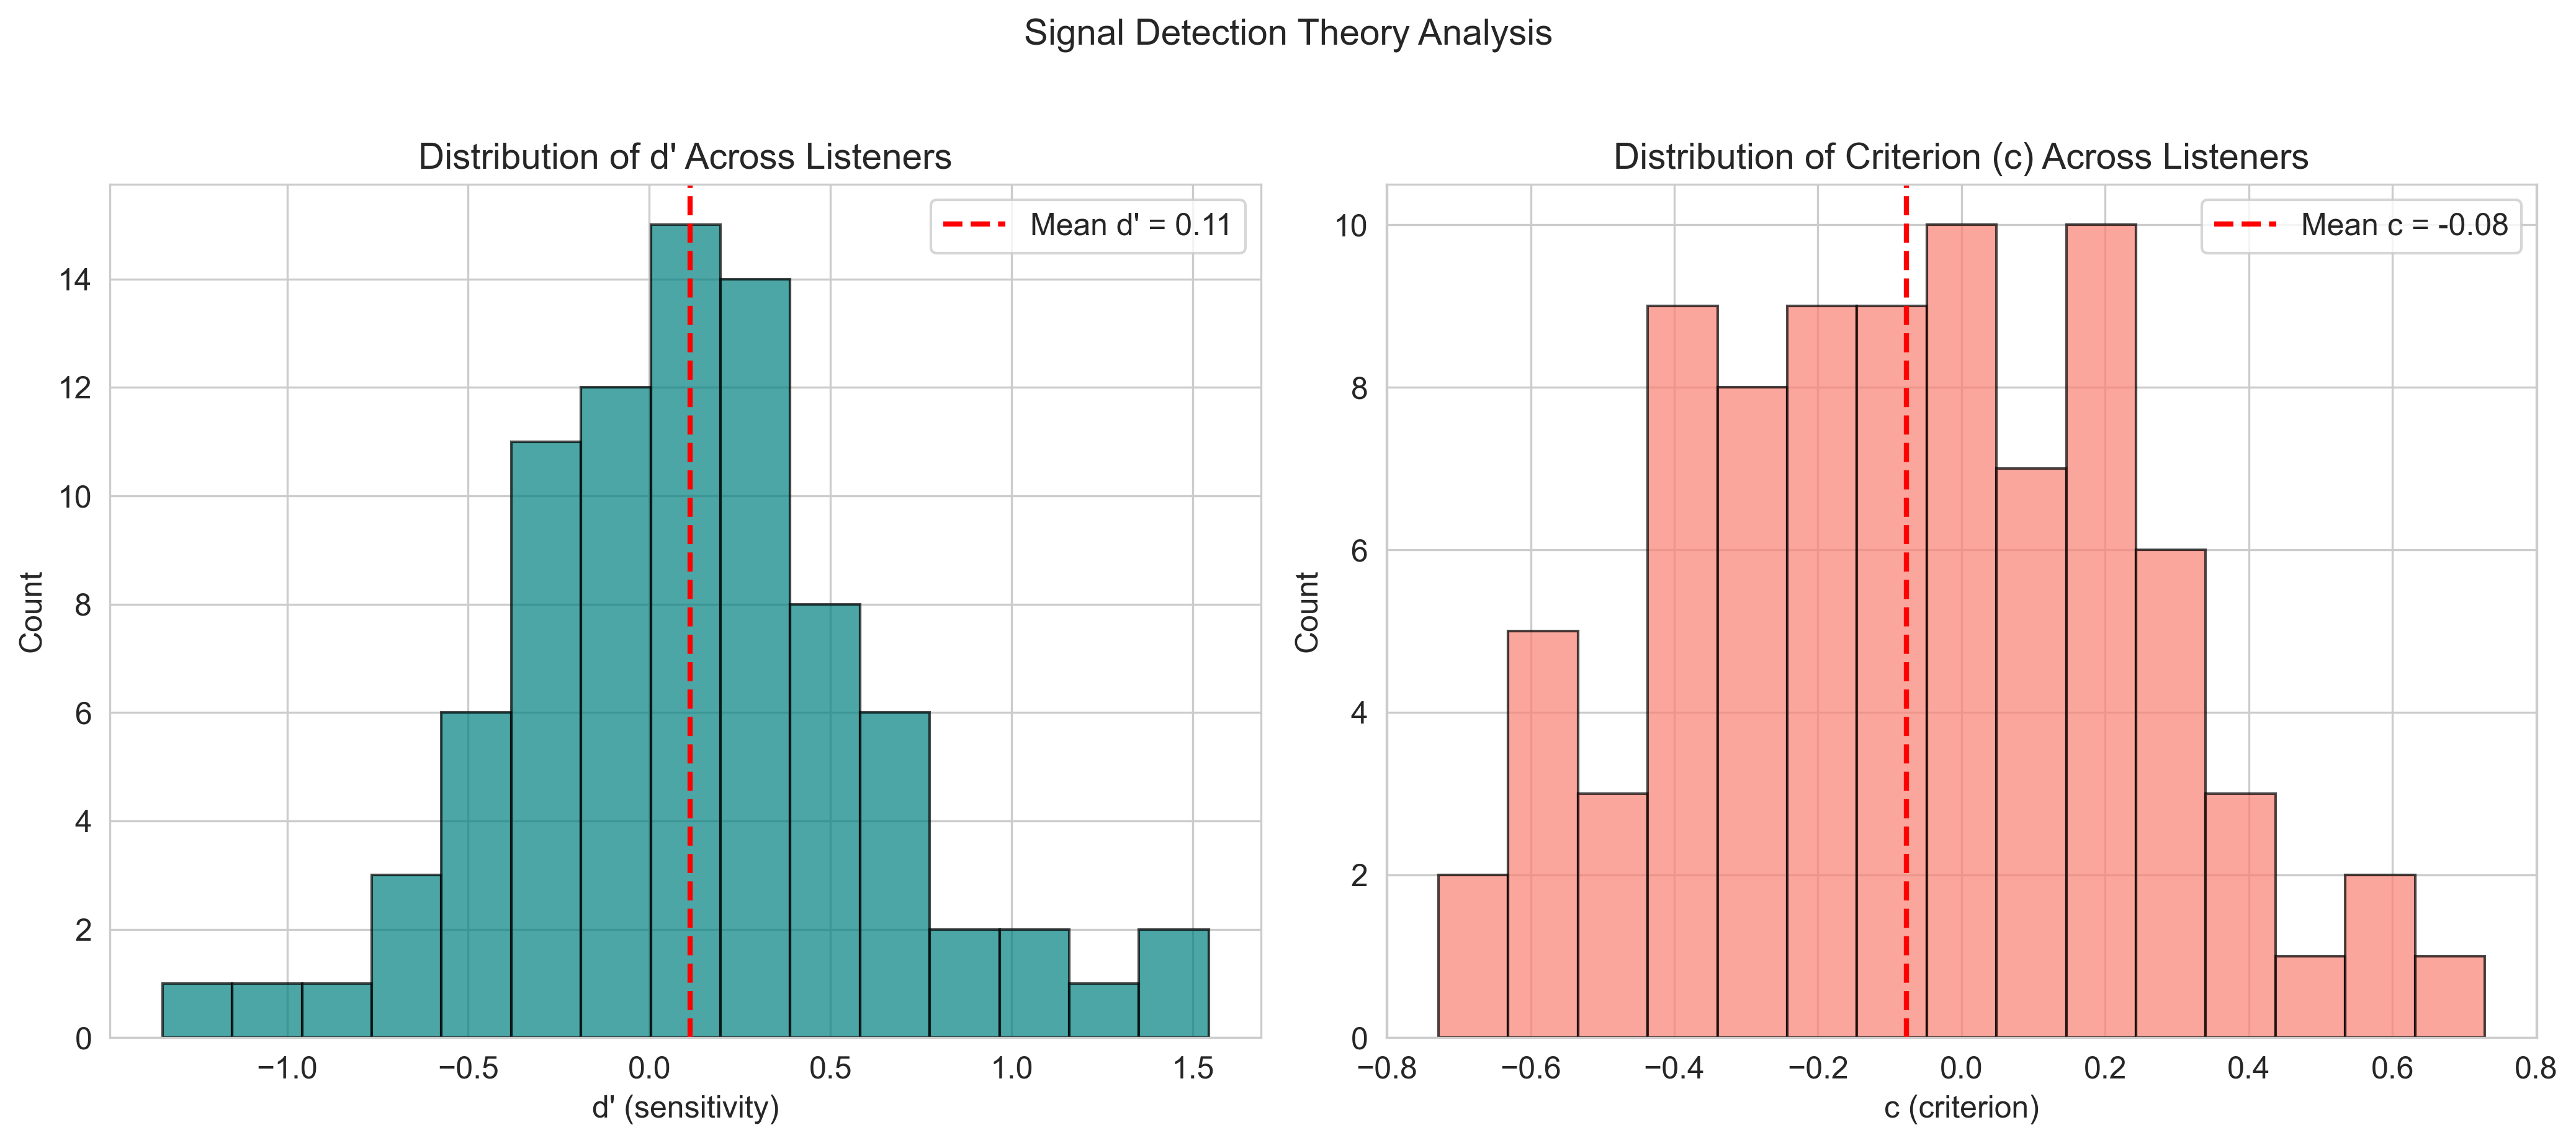
8A — Distributions of d' (sensitivity) and c (criterion) across listeners. Mean d' = 0.11, Mean c = −0.08.
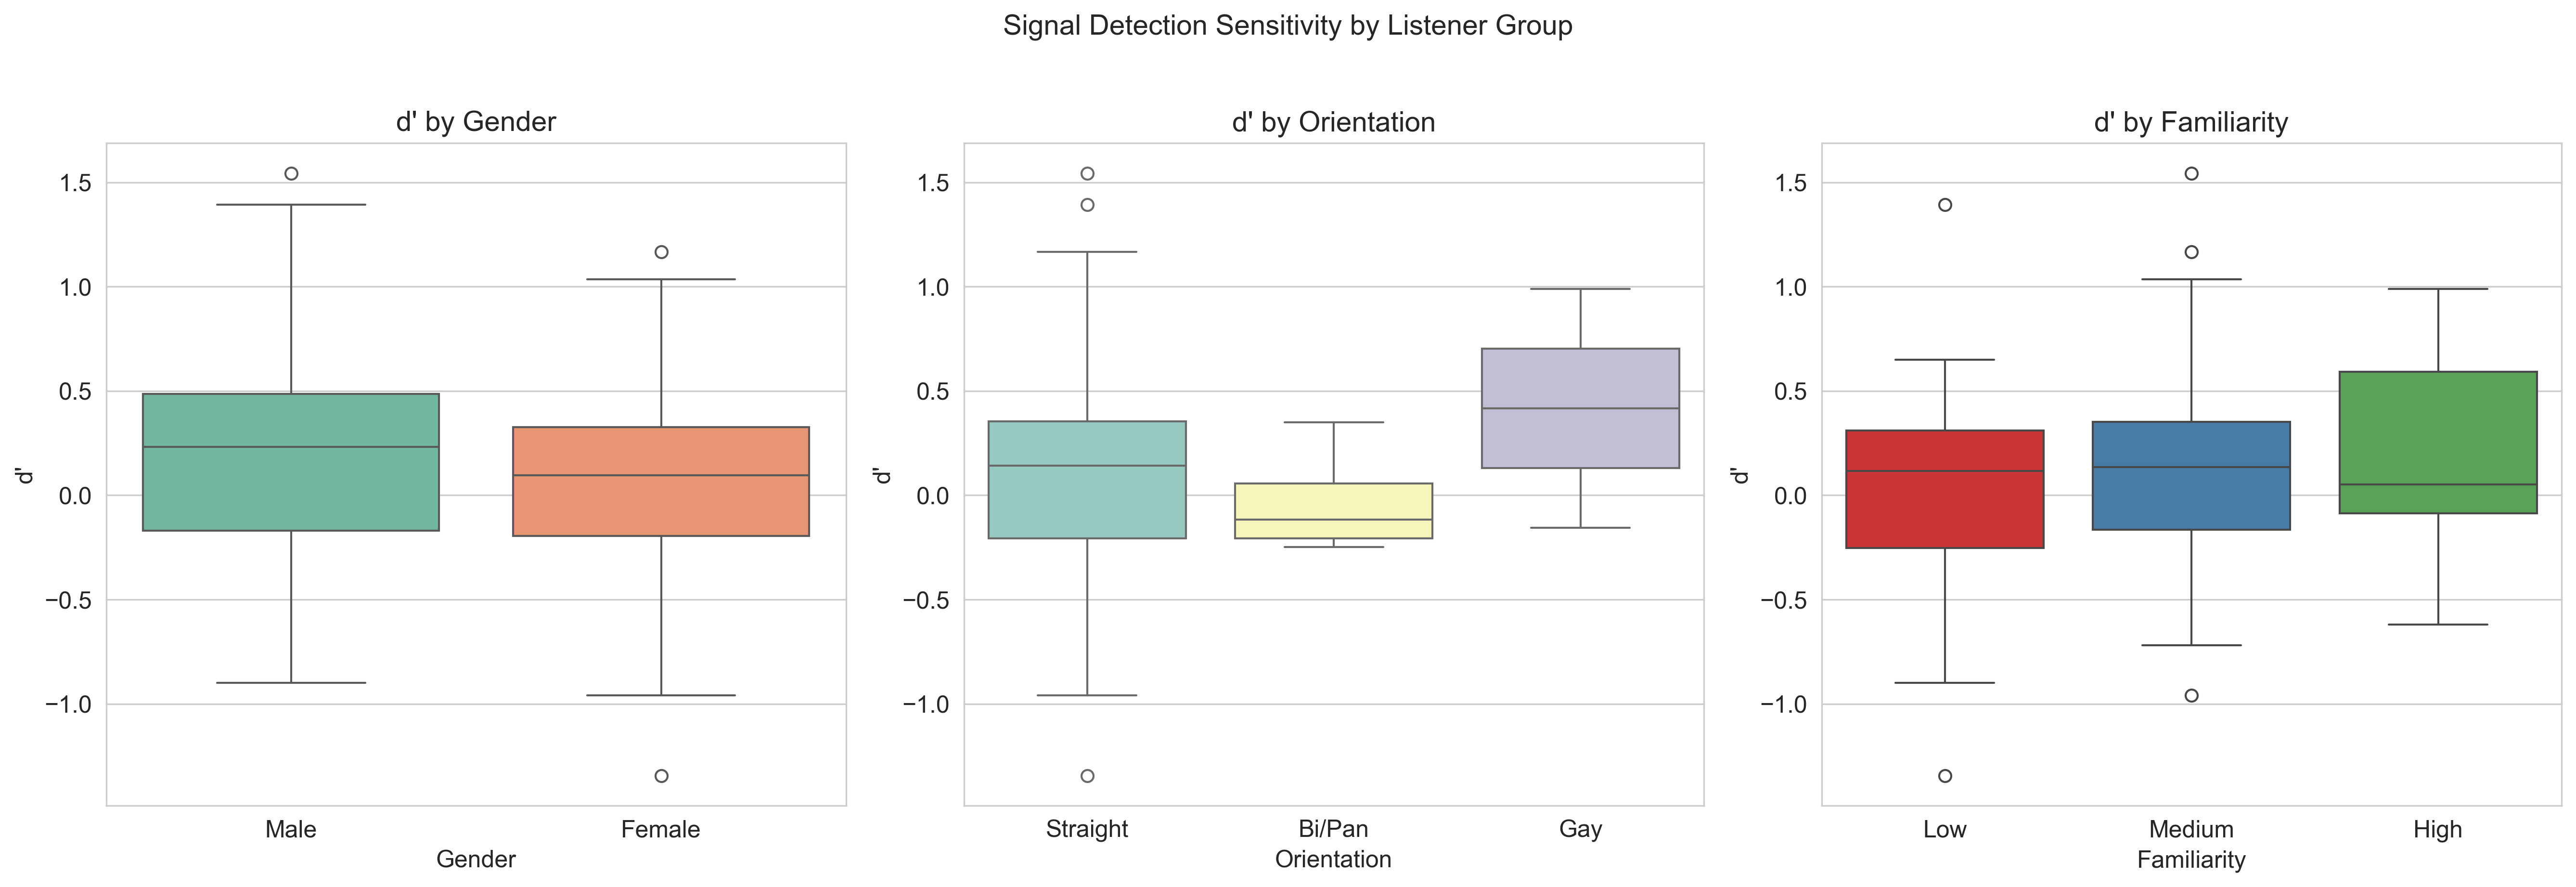
8B — d' (sensitivity) broken down by listener demographic group.
Section 9: Error by Speaker
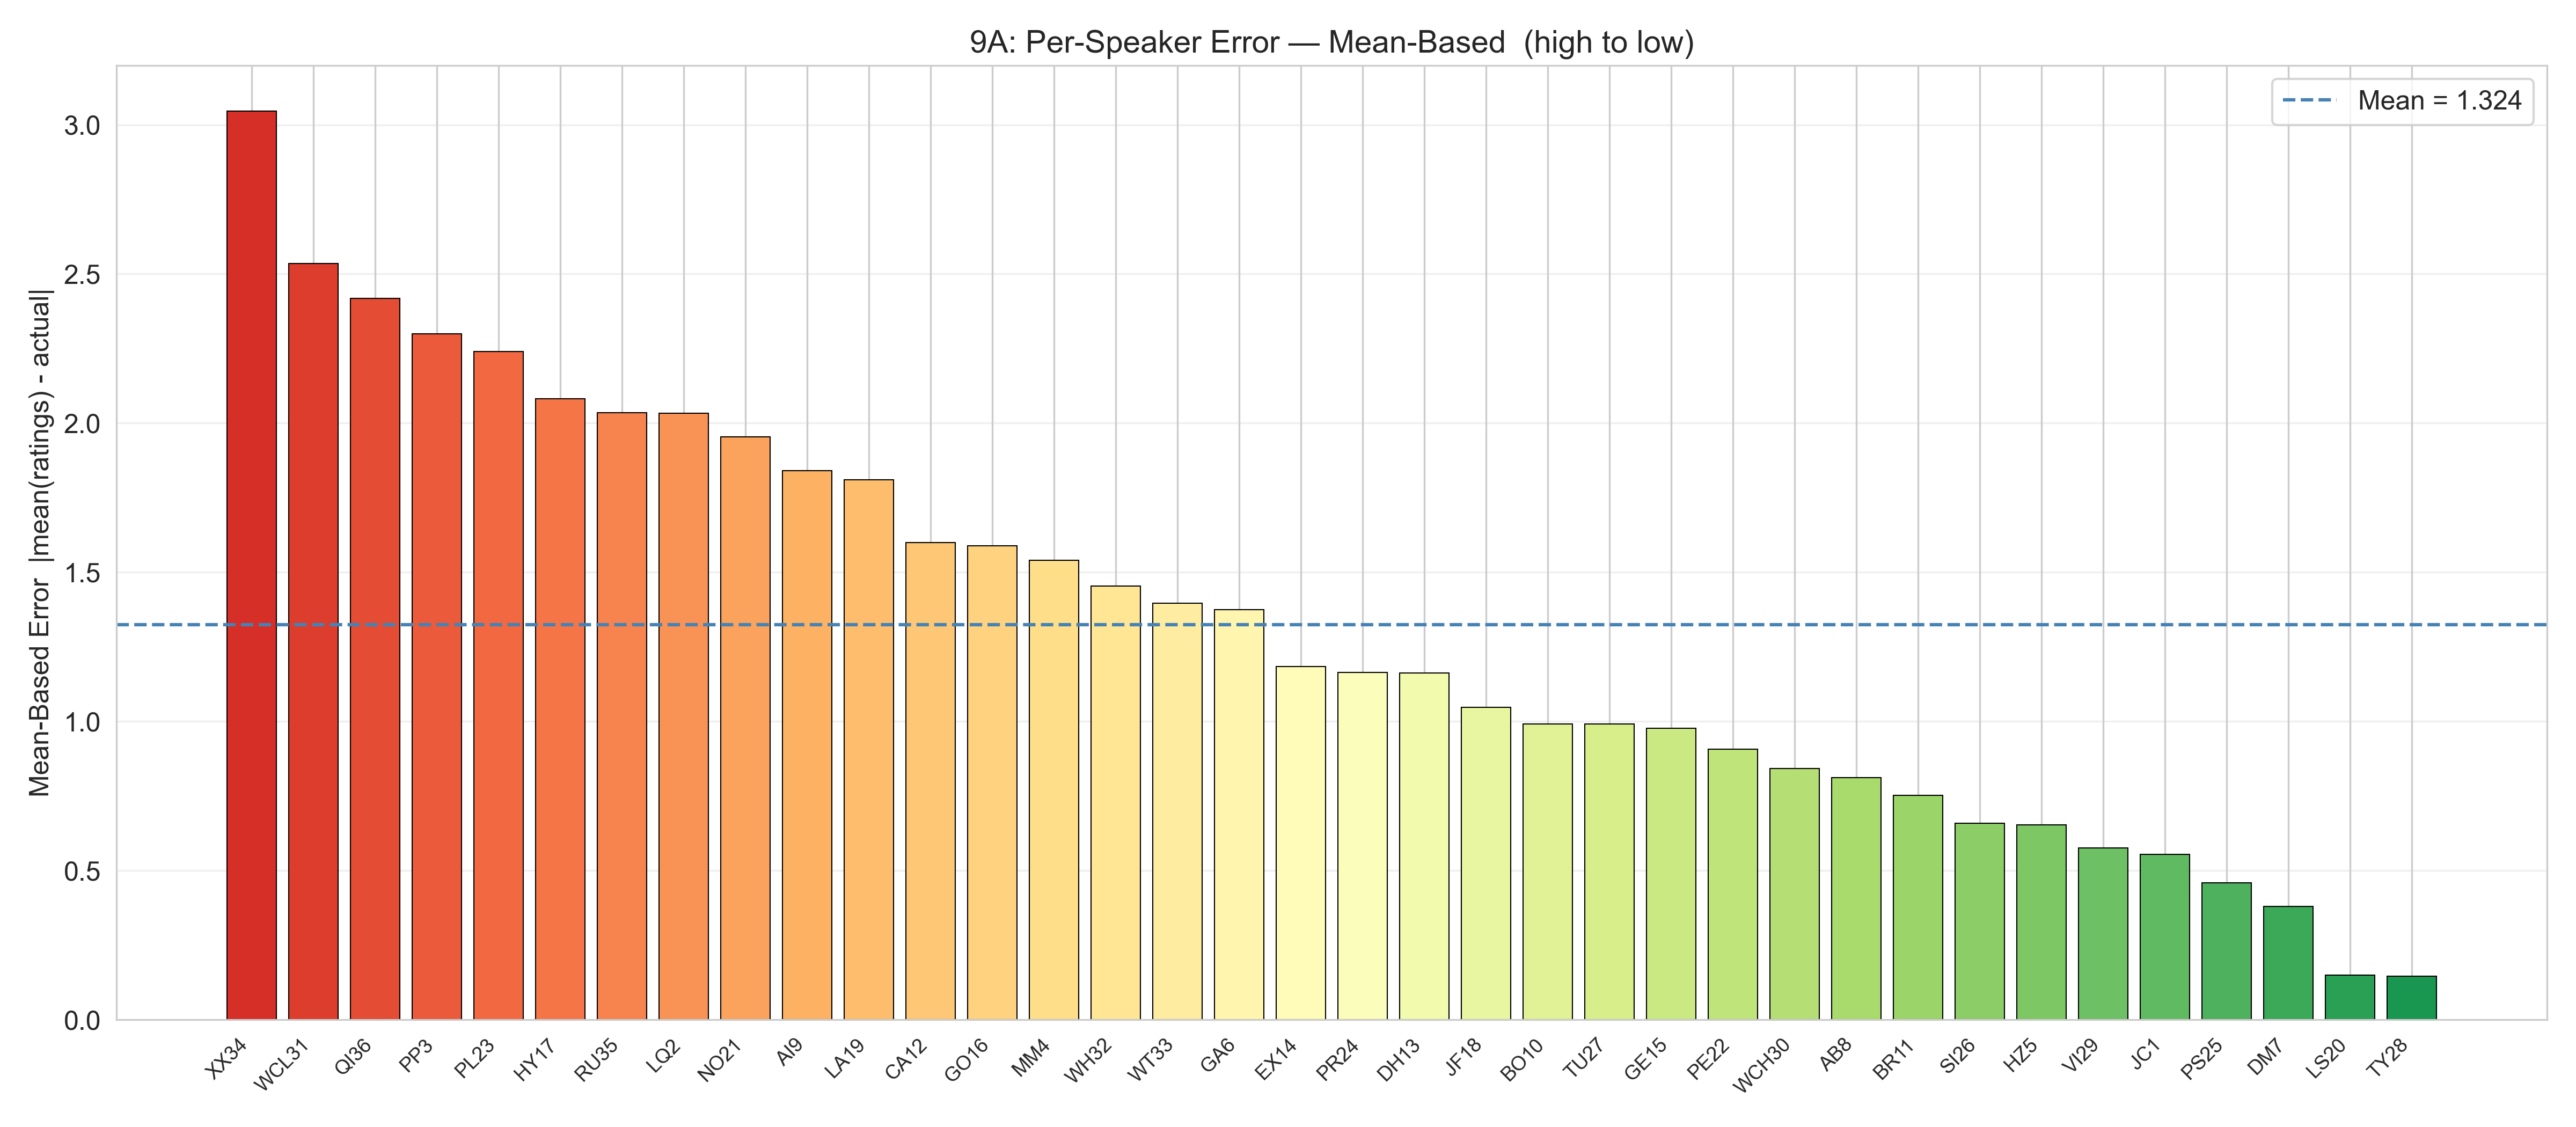
9A — Mean-based prediction error for each individual speaker.
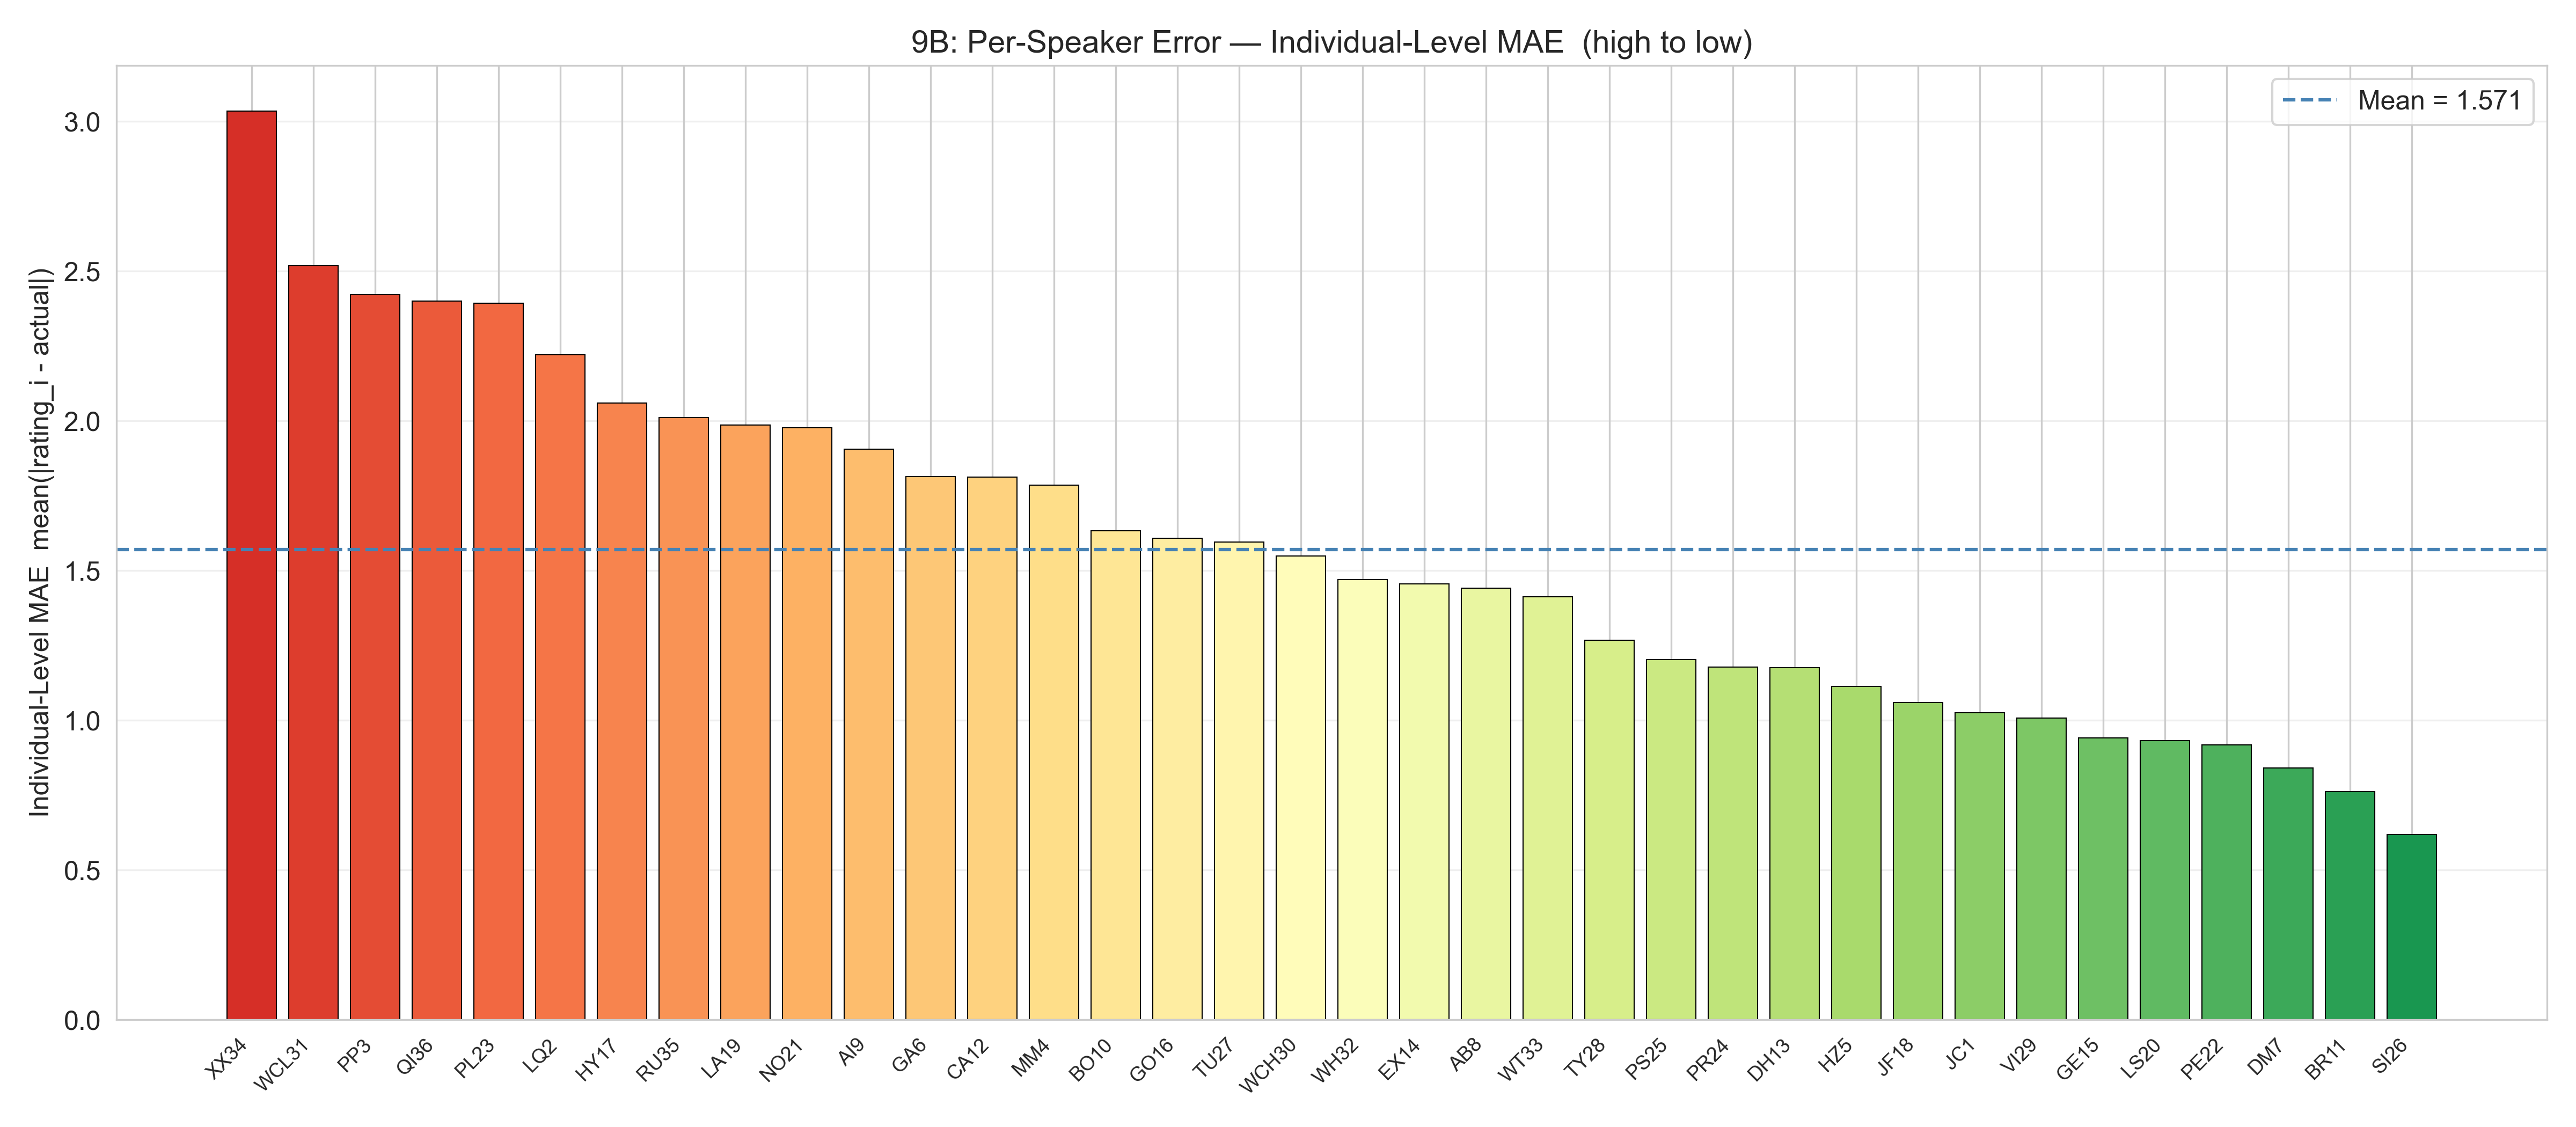
9B — Individual listener MAE for each speaker.
Speaker Rating Histograms
Distribution of listener ratings (1–5) for each individual speaker.
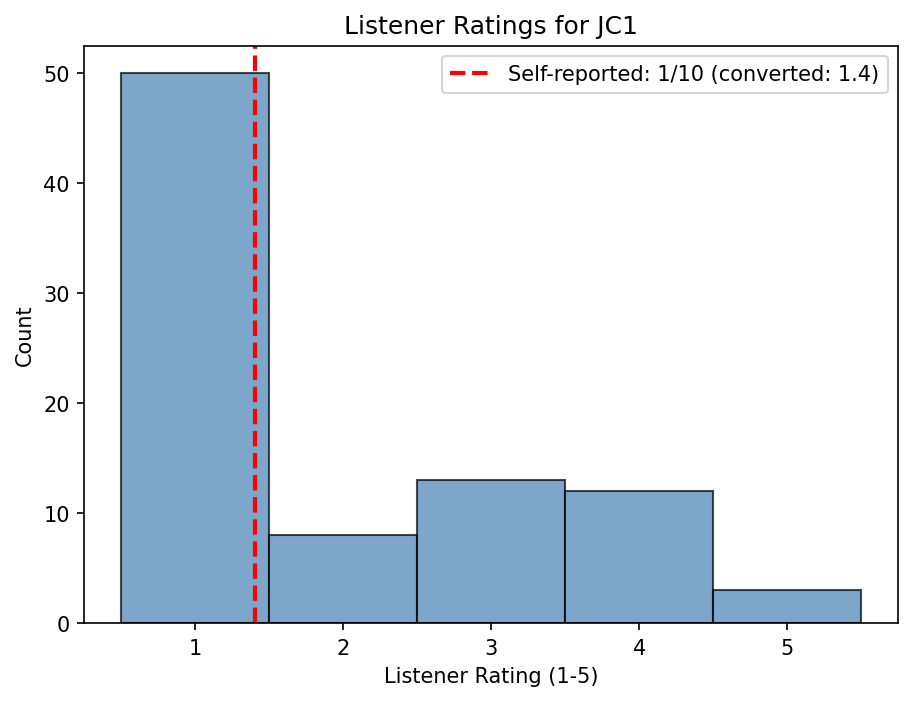
Speaker JC1
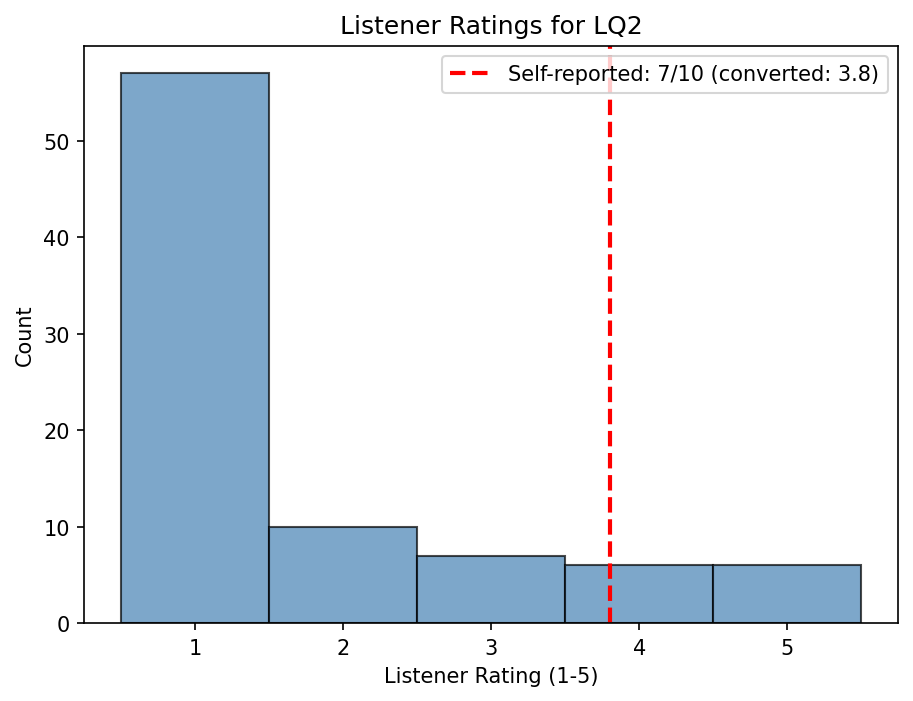
Speaker LQ2
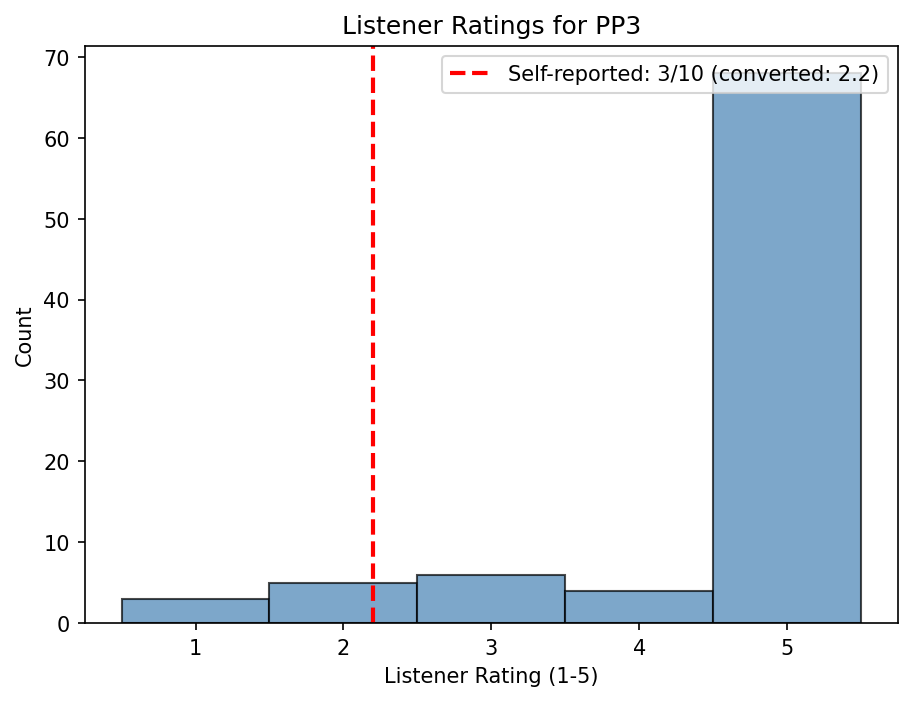
Speaker PP3
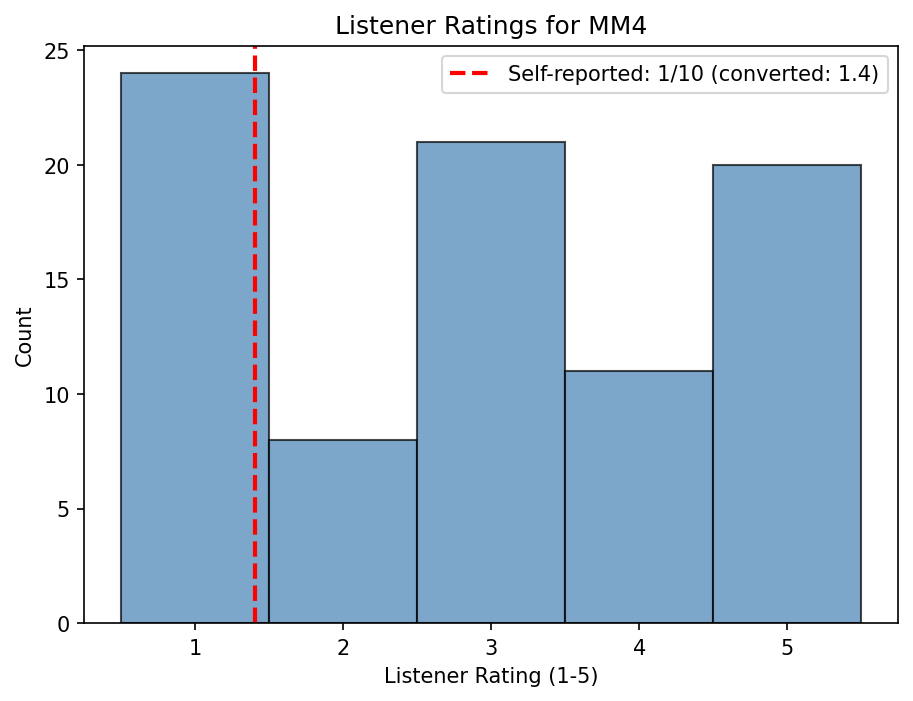
Speaker MM4
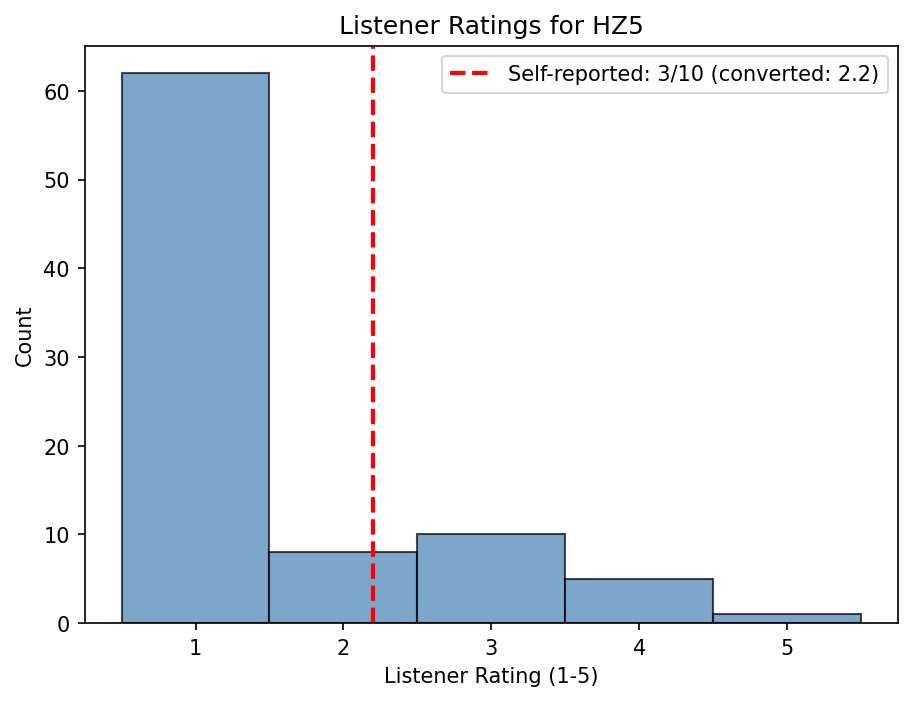
Speaker HZ5
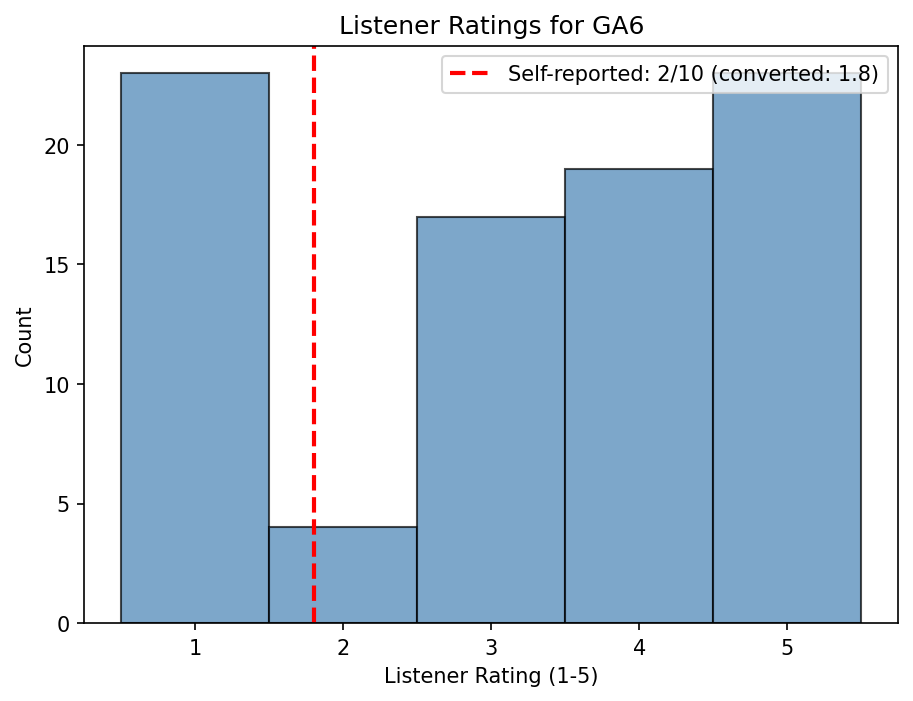
Speaker GA6
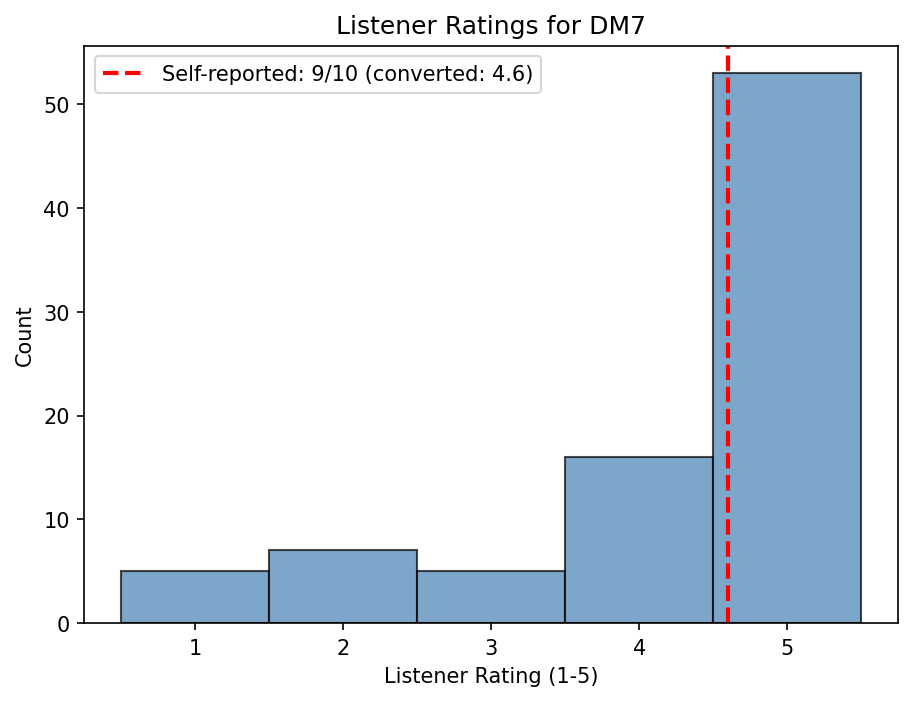
Speaker DM7
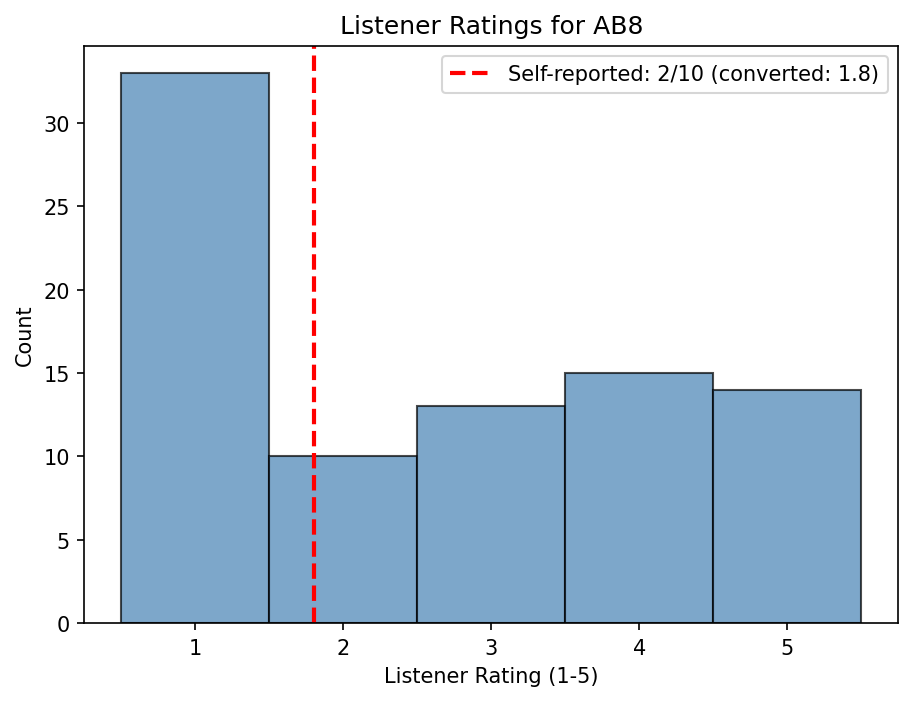
Speaker AB8
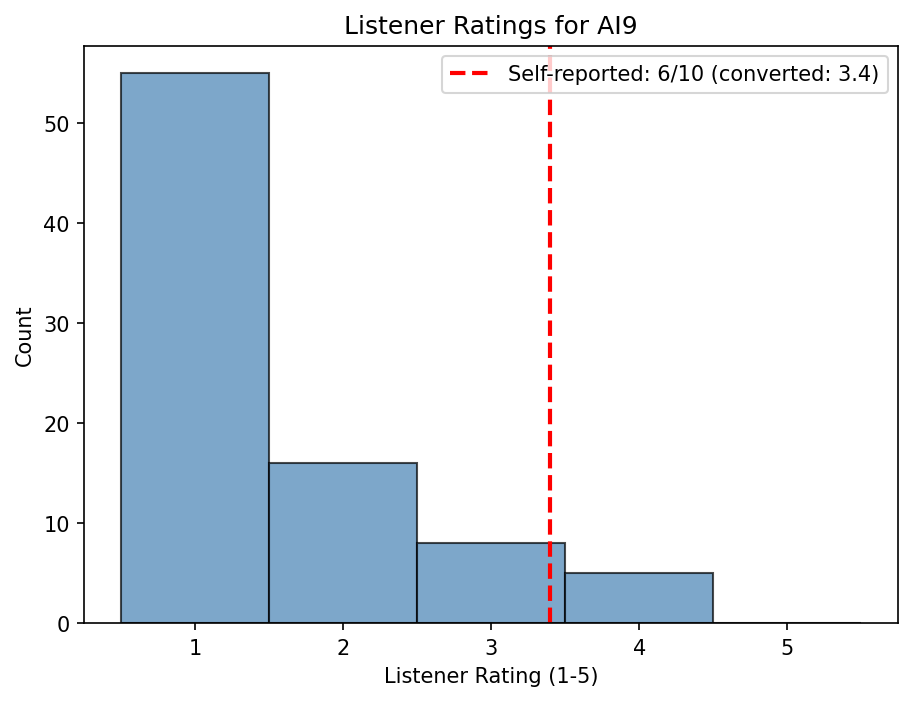
Speaker AI9
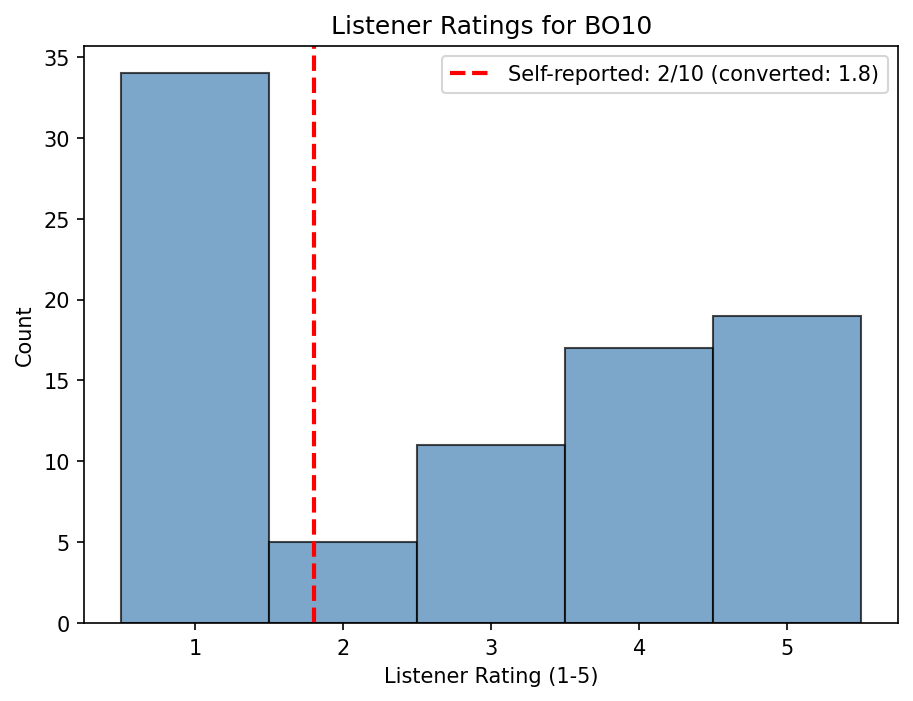
Speaker BO10
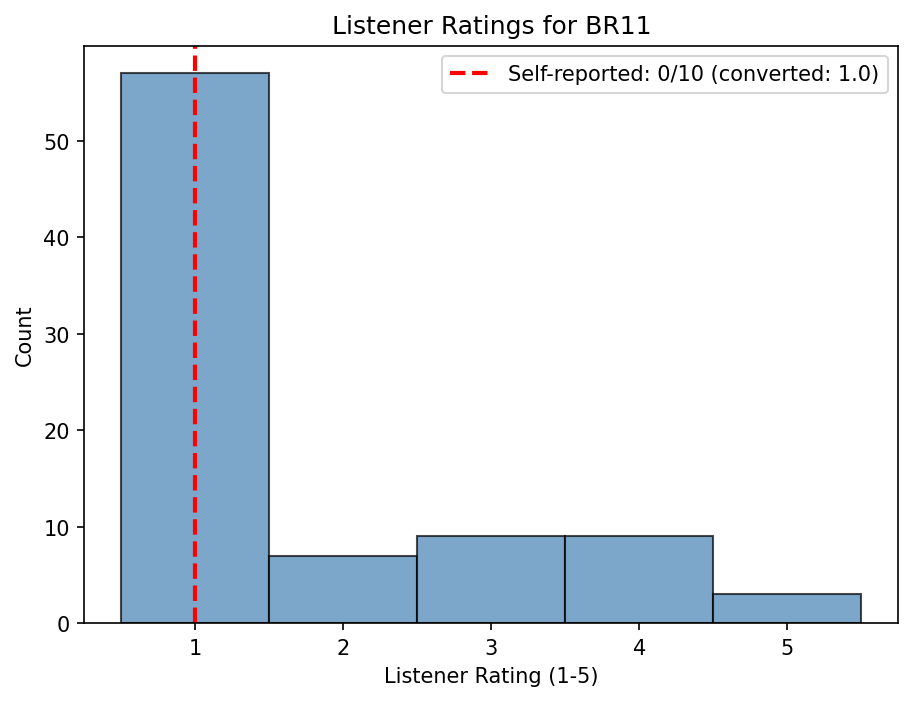
Speaker BR11
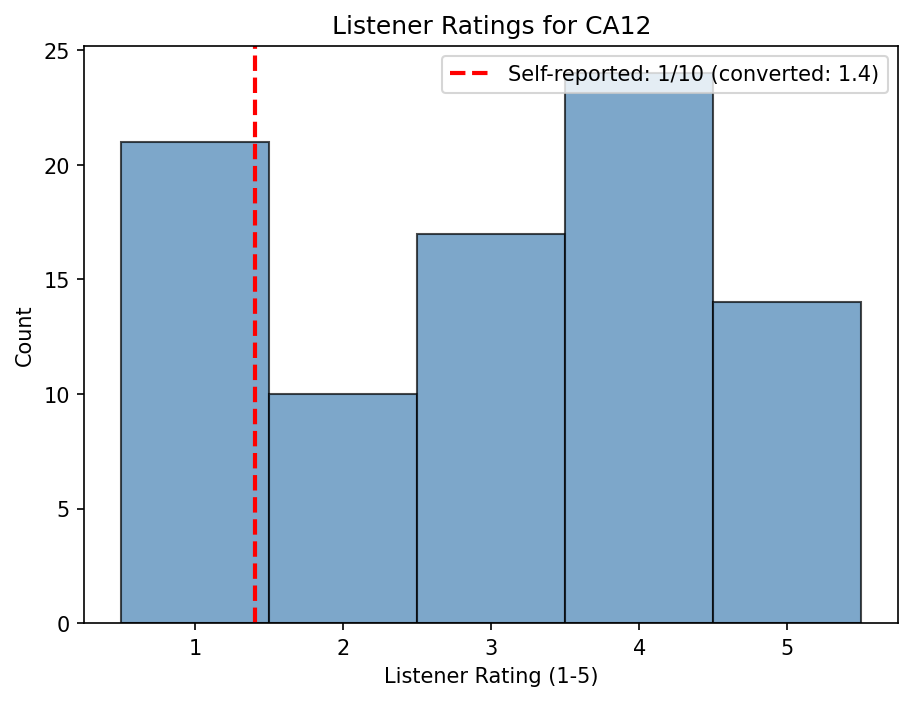
Speaker CA12
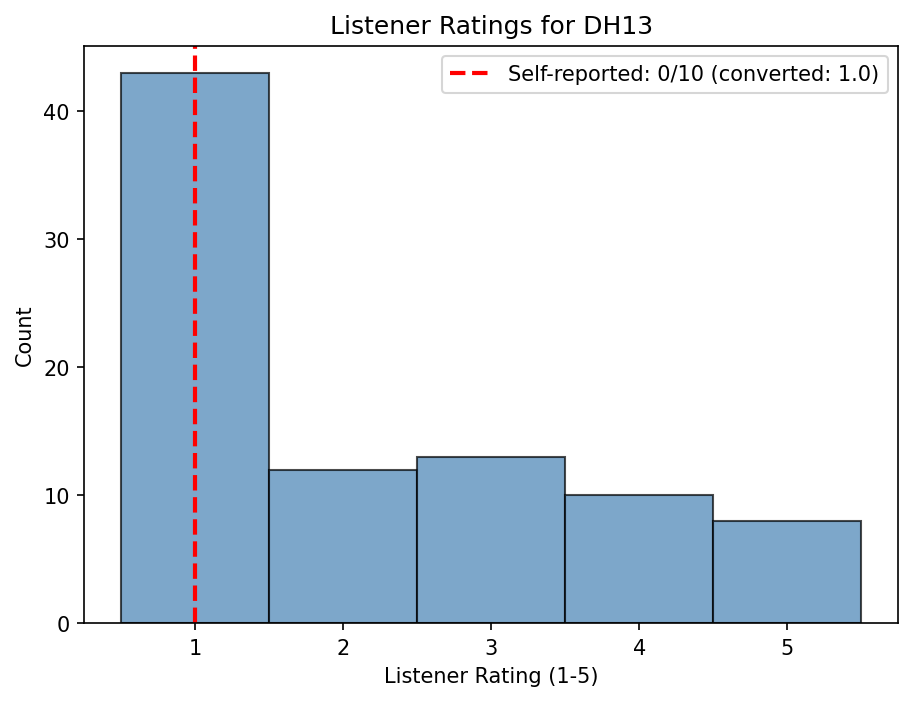
Speaker DH13
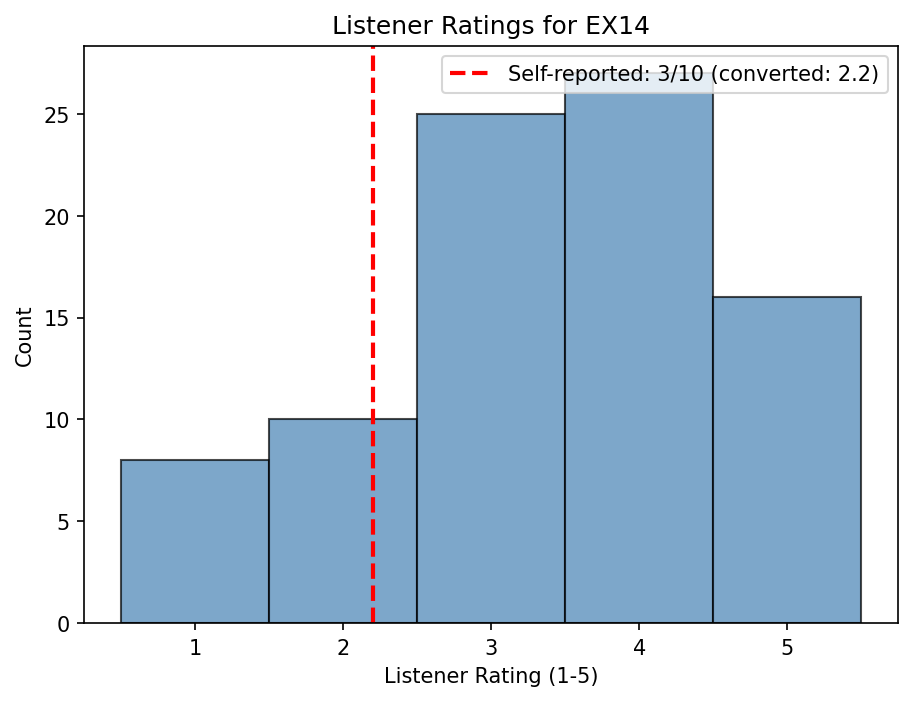
Speaker EX14
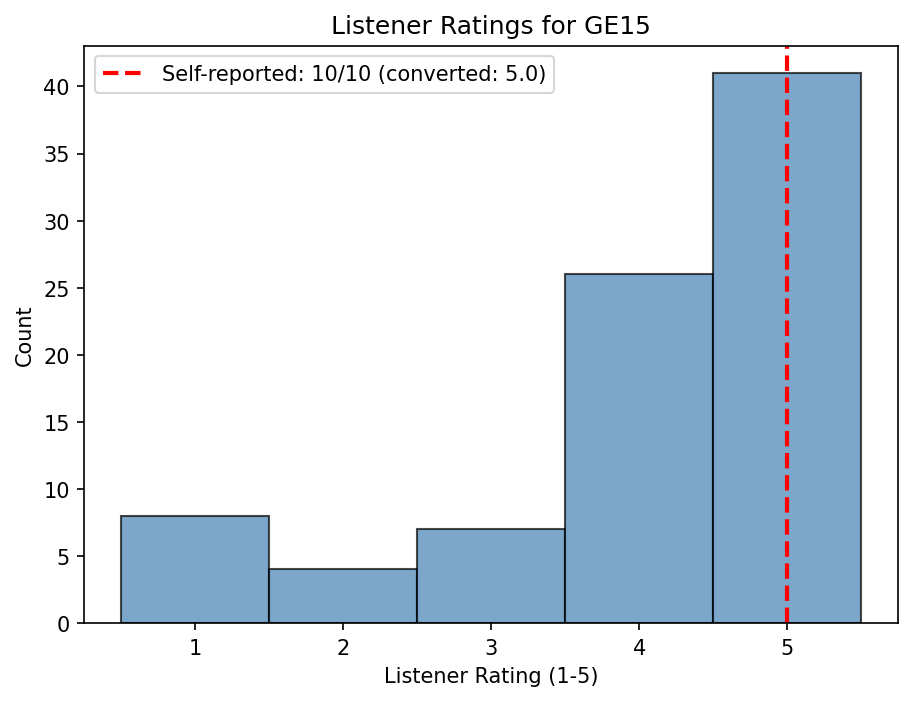
Speaker GE15
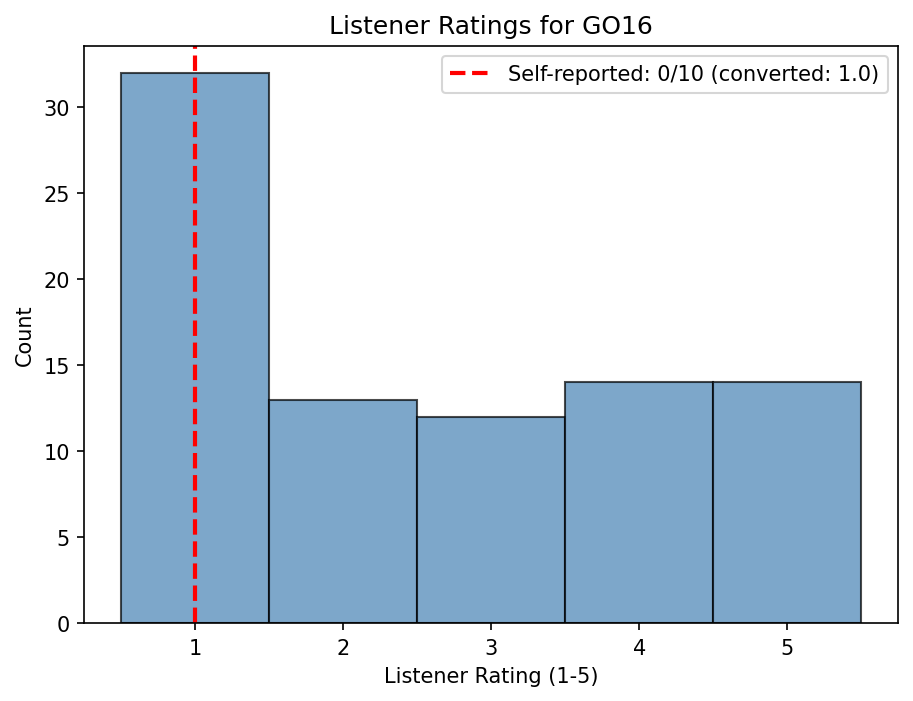
Speaker GO16
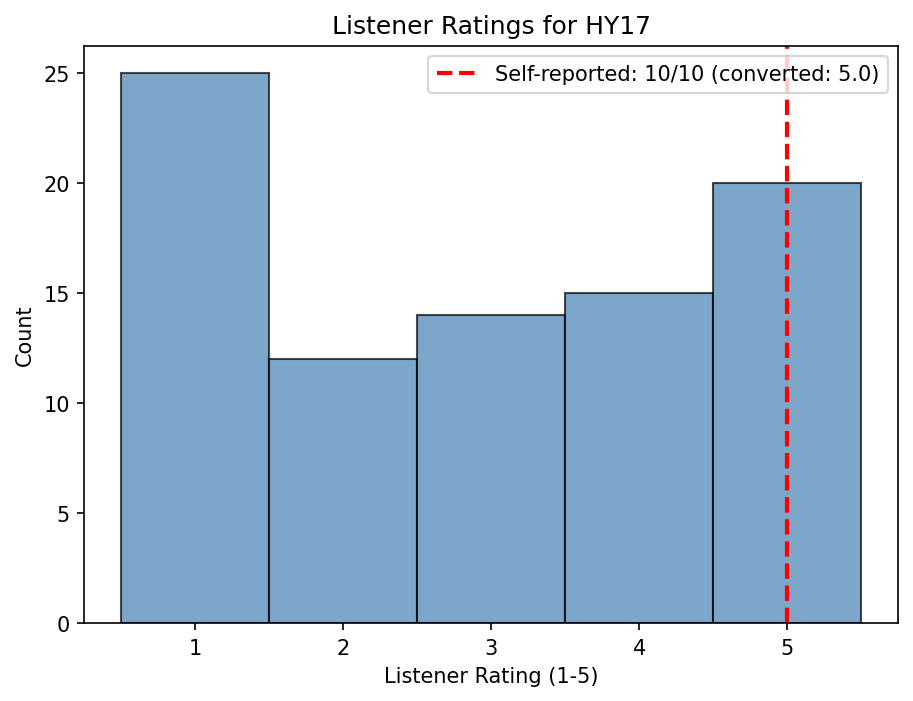
Speaker HY17
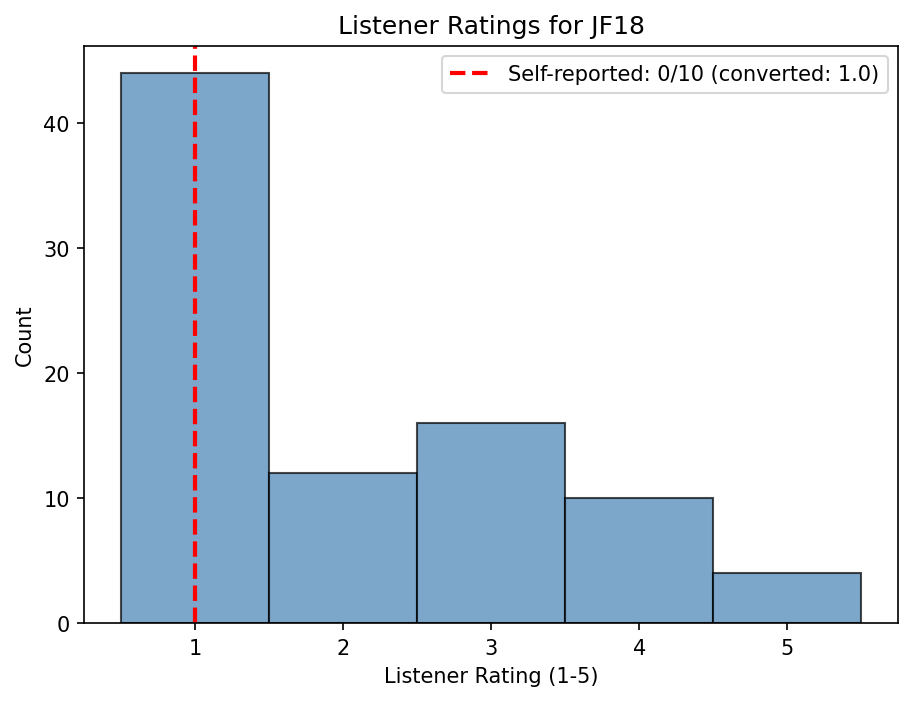
Speaker JF18
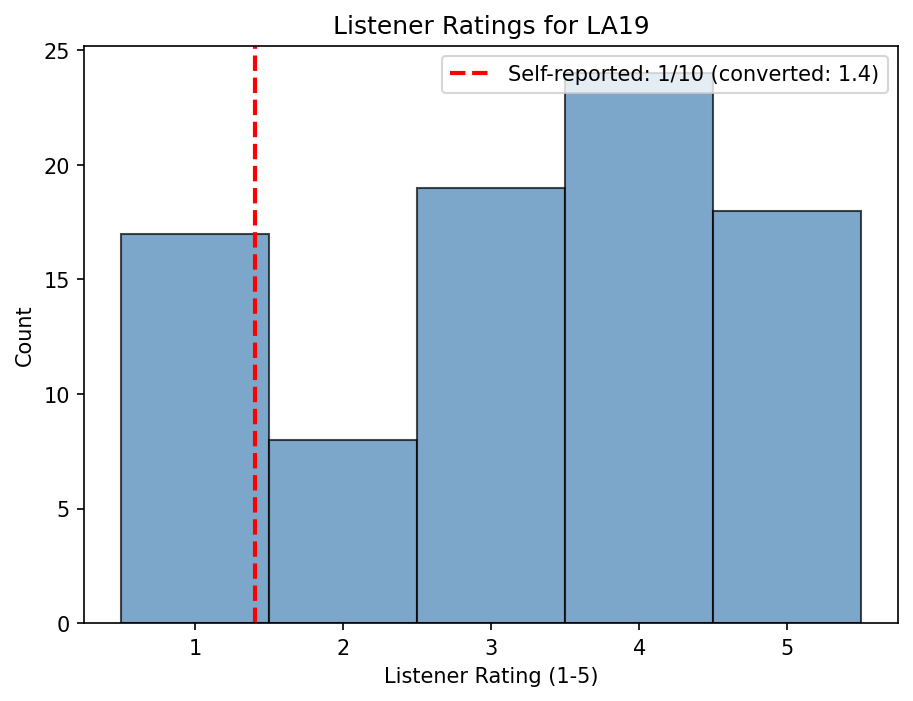
Speaker LA19
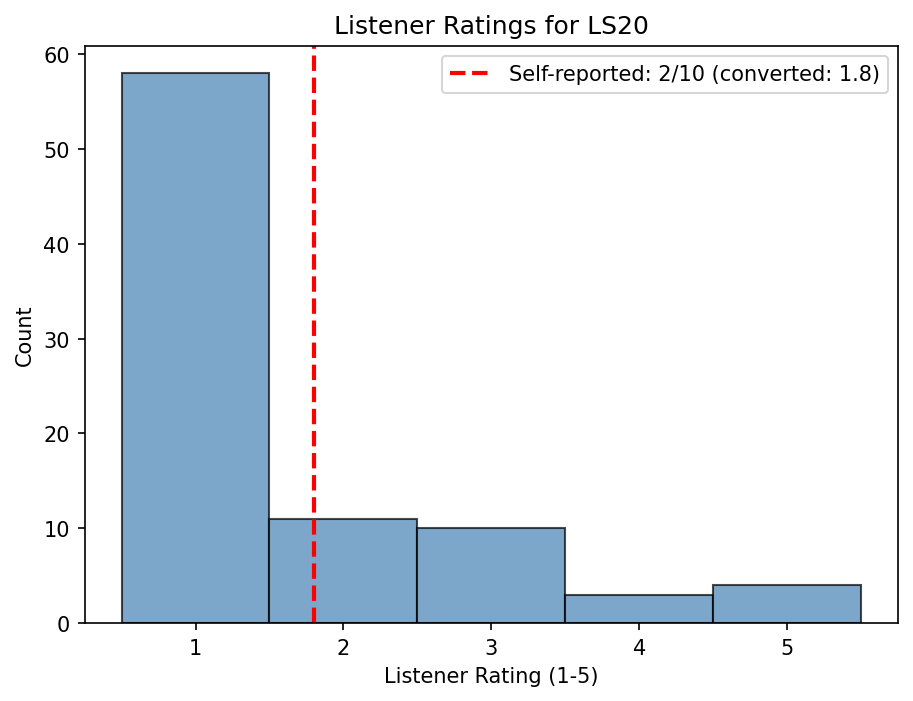
Speaker LS20
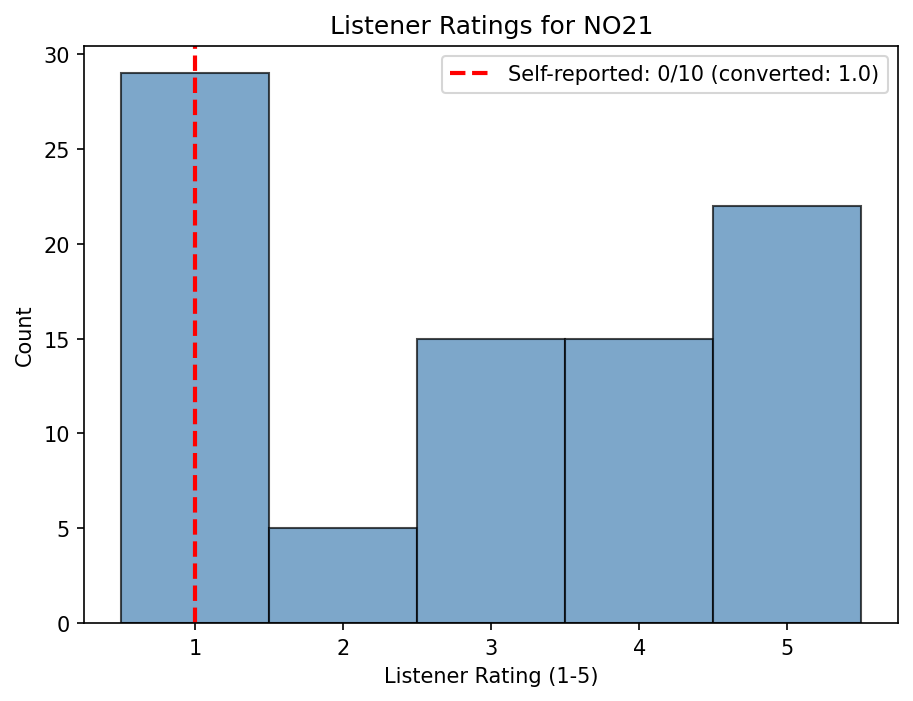
Speaker NO21
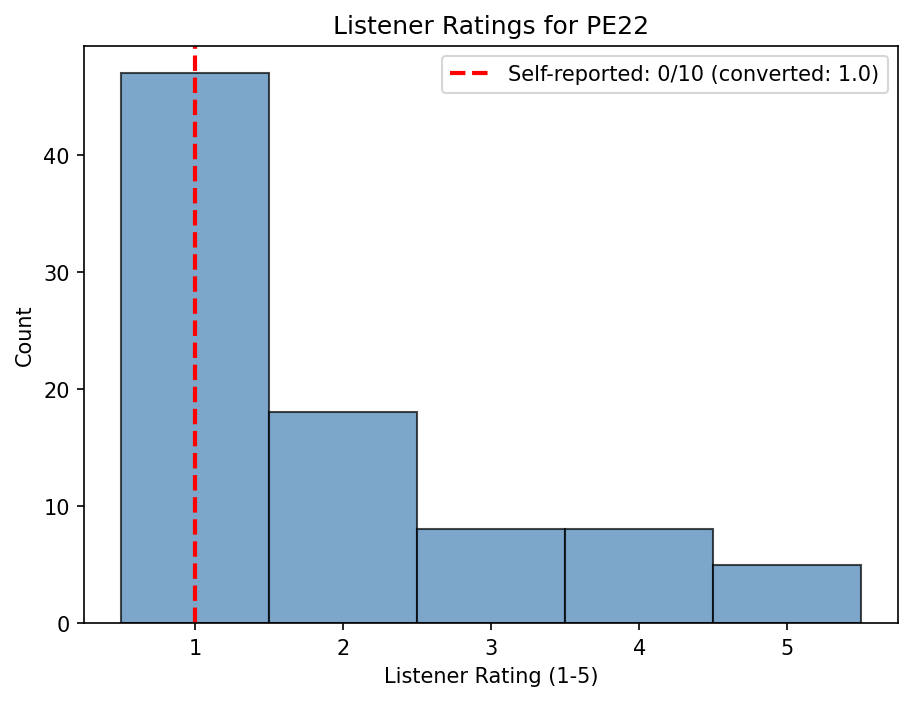
Speaker PE22
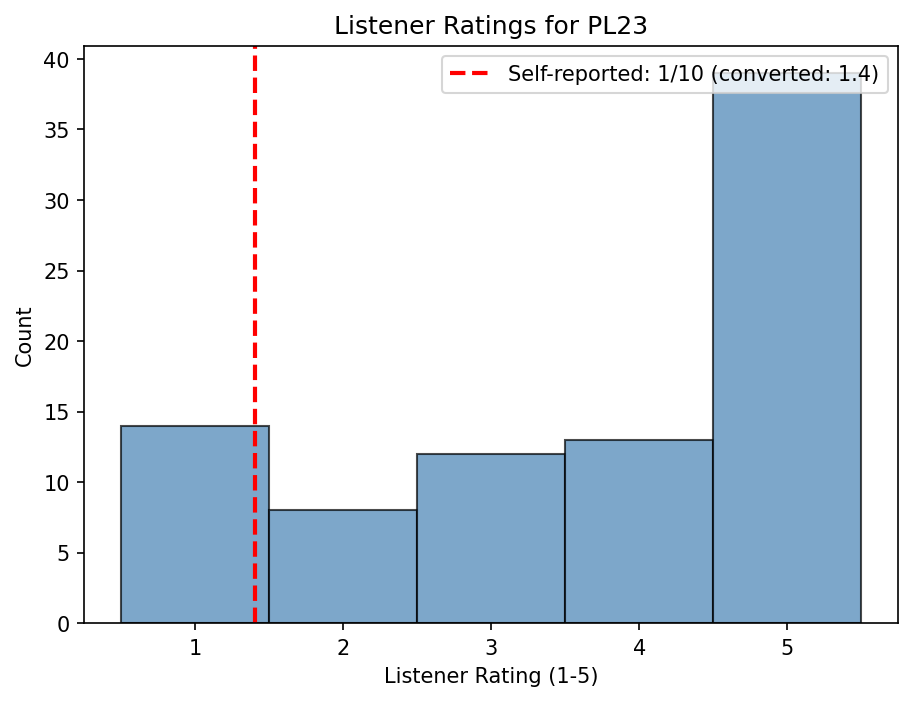
Speaker PL23
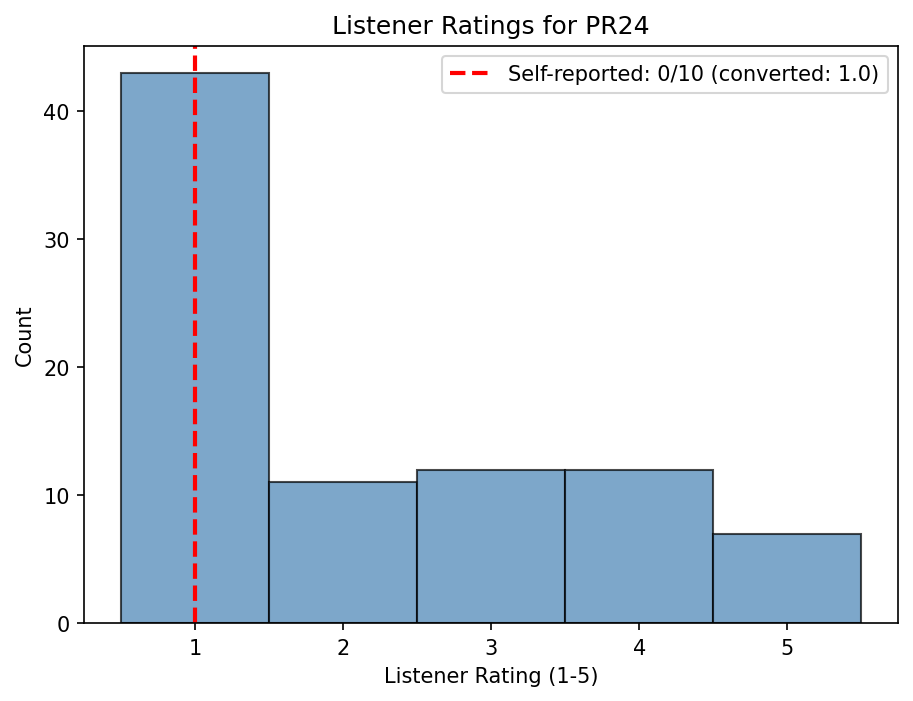
Speaker PR24
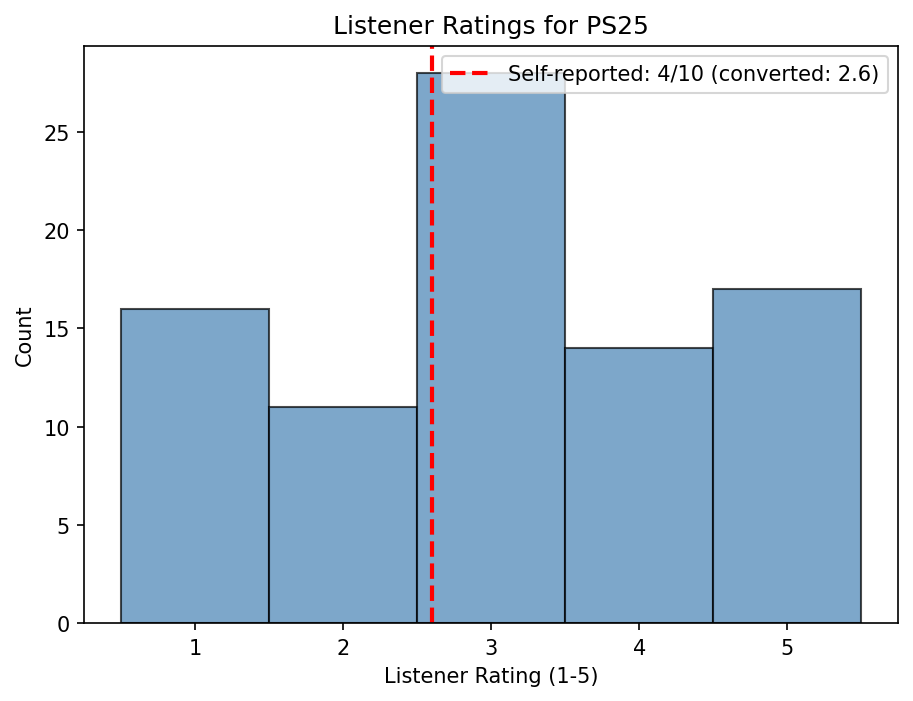
Speaker PS25
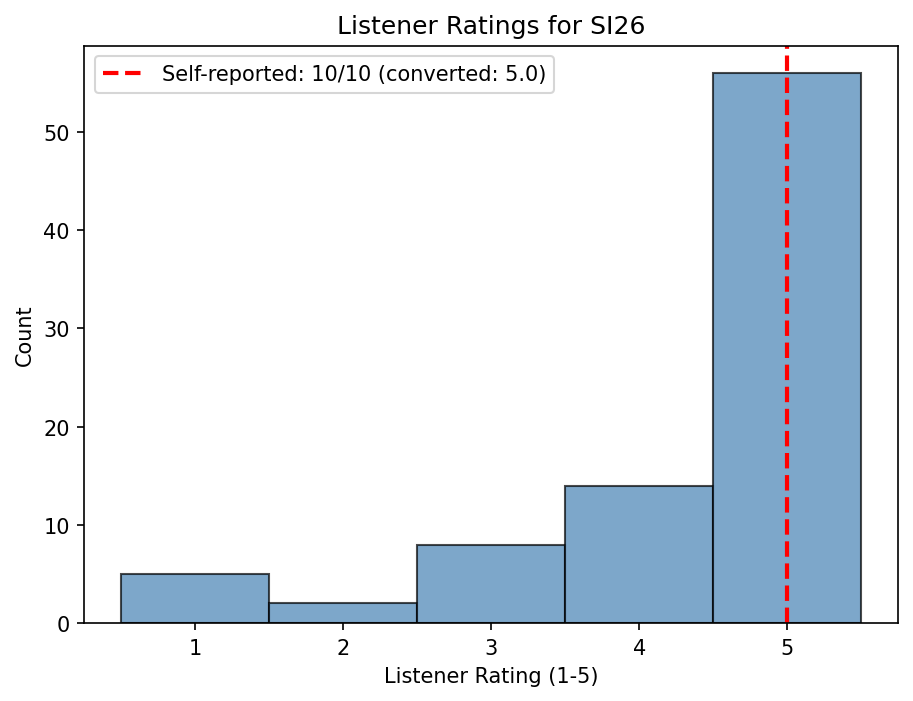
Speaker SI26
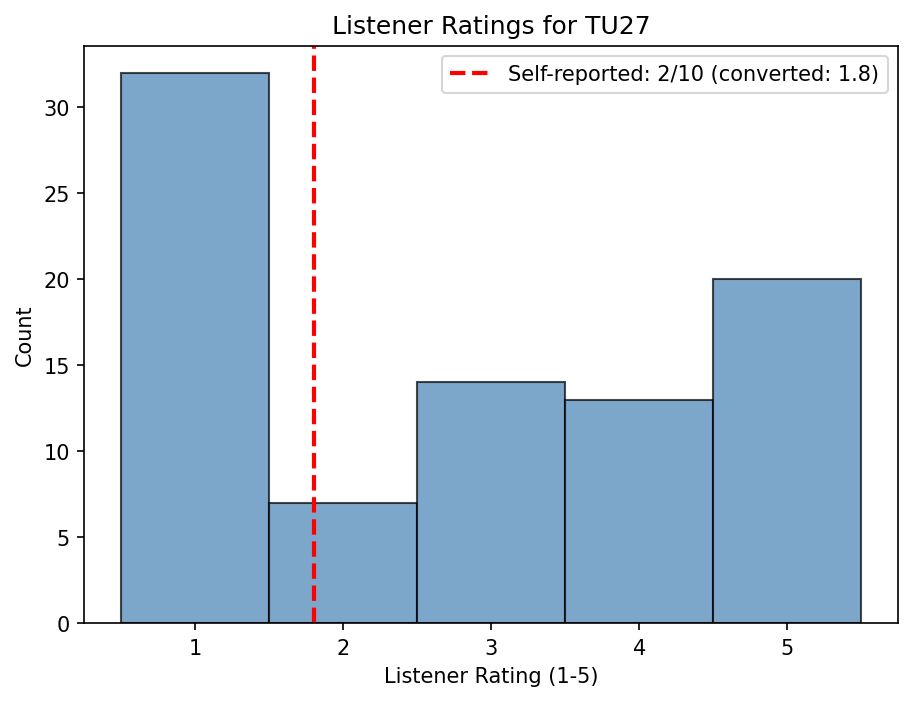
Speaker TU27
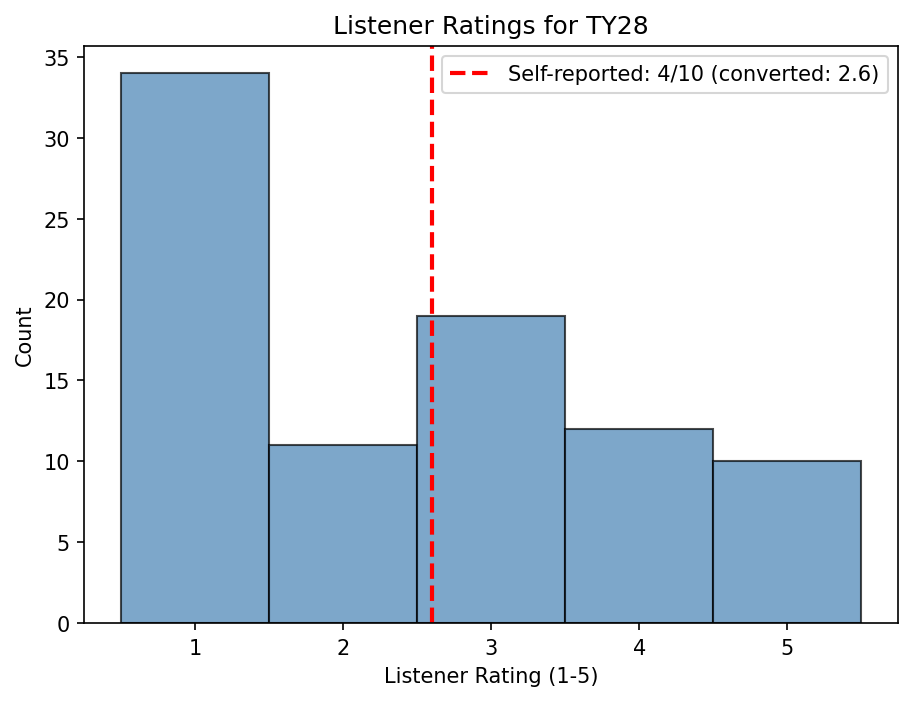
Speaker TY28
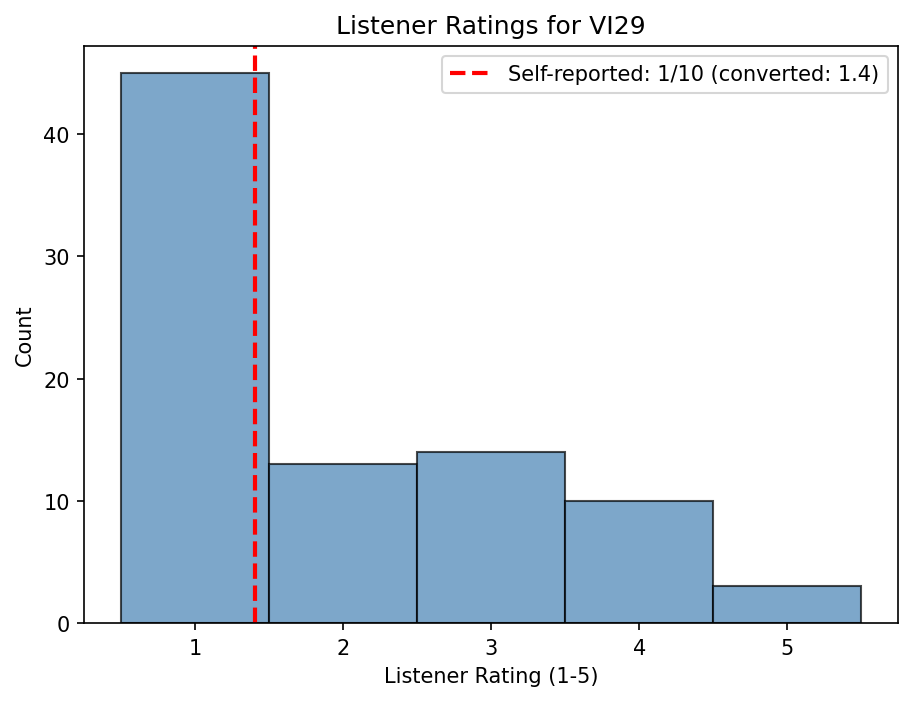
Speaker VI29
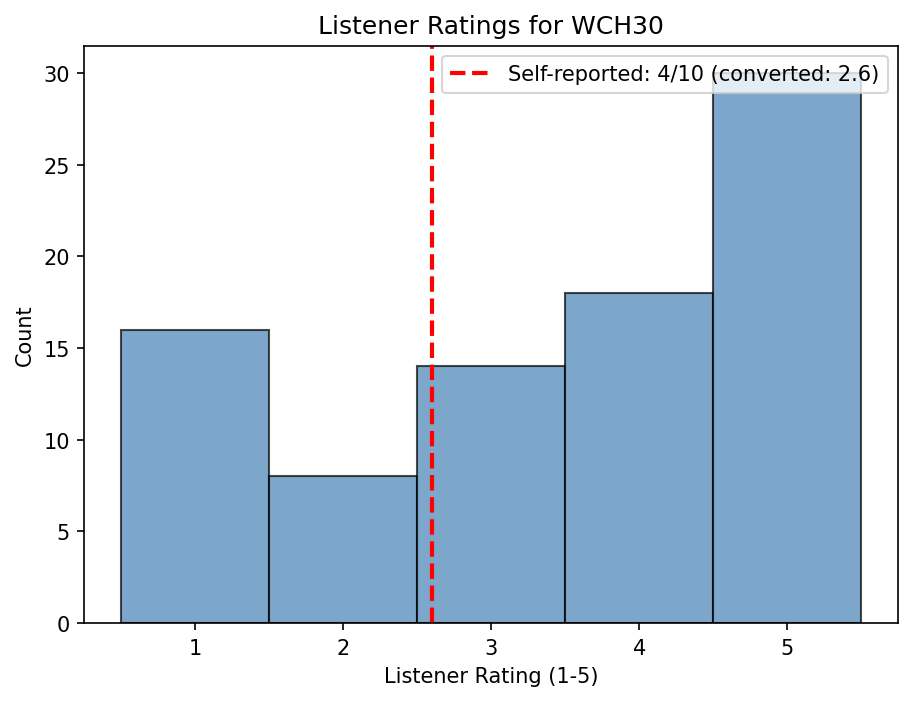
Speaker WCH30
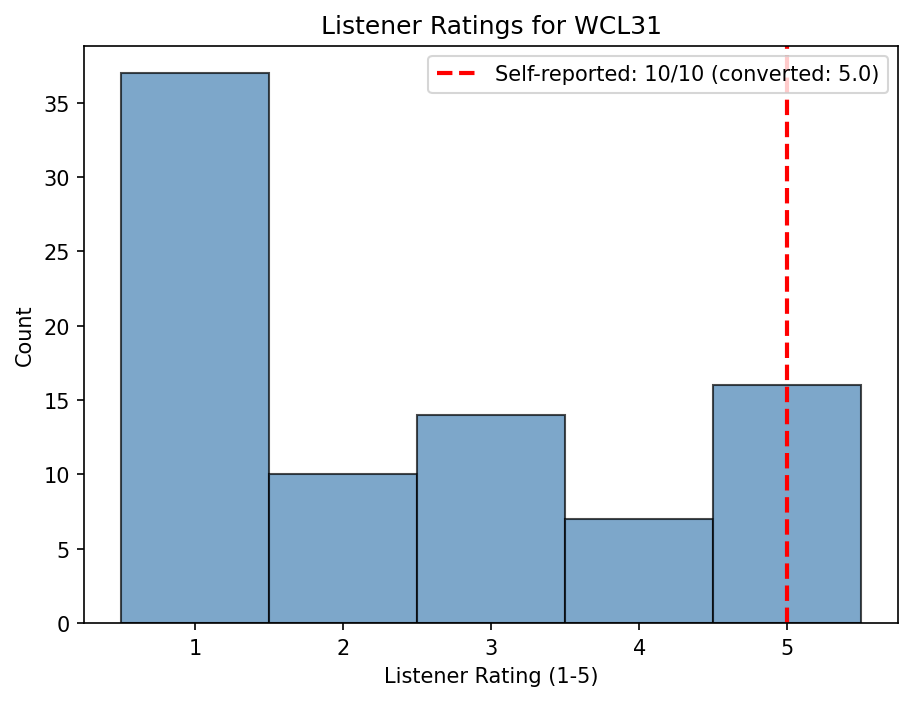
Speaker WCL31
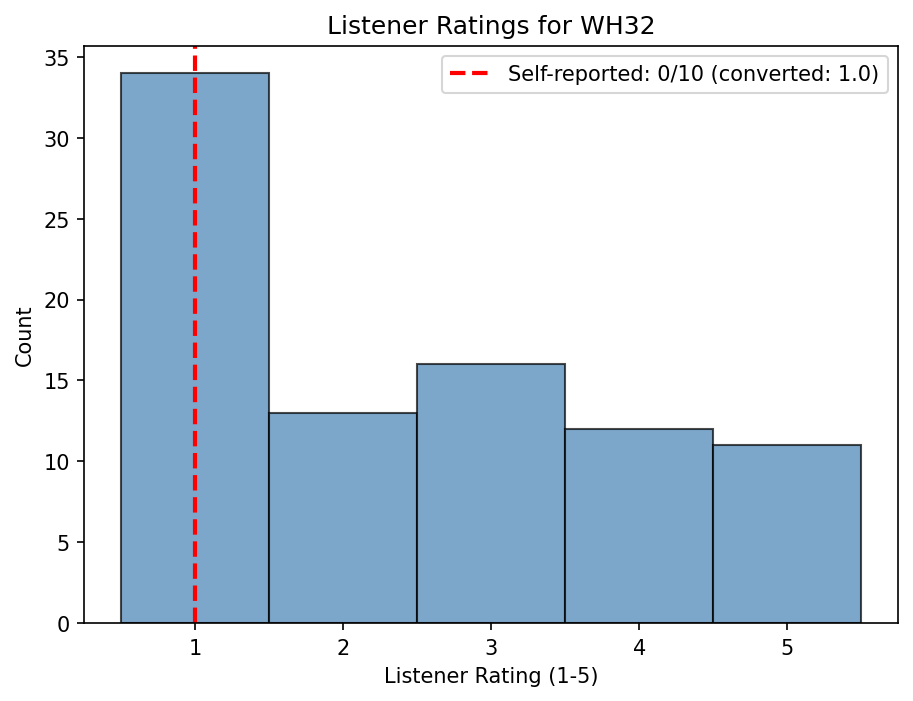
Speaker WH32
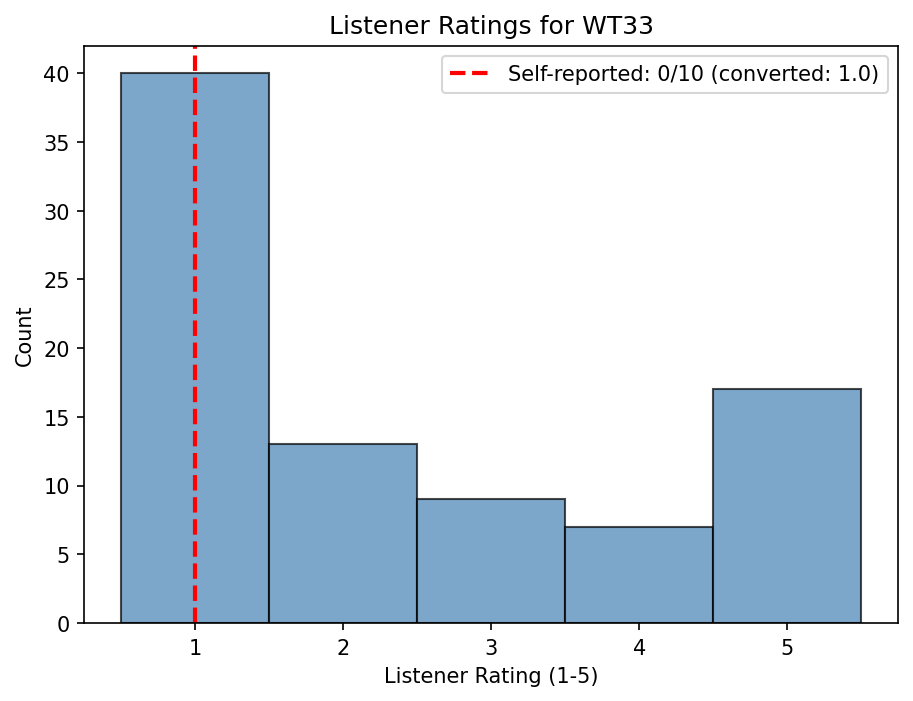
Speaker WT33
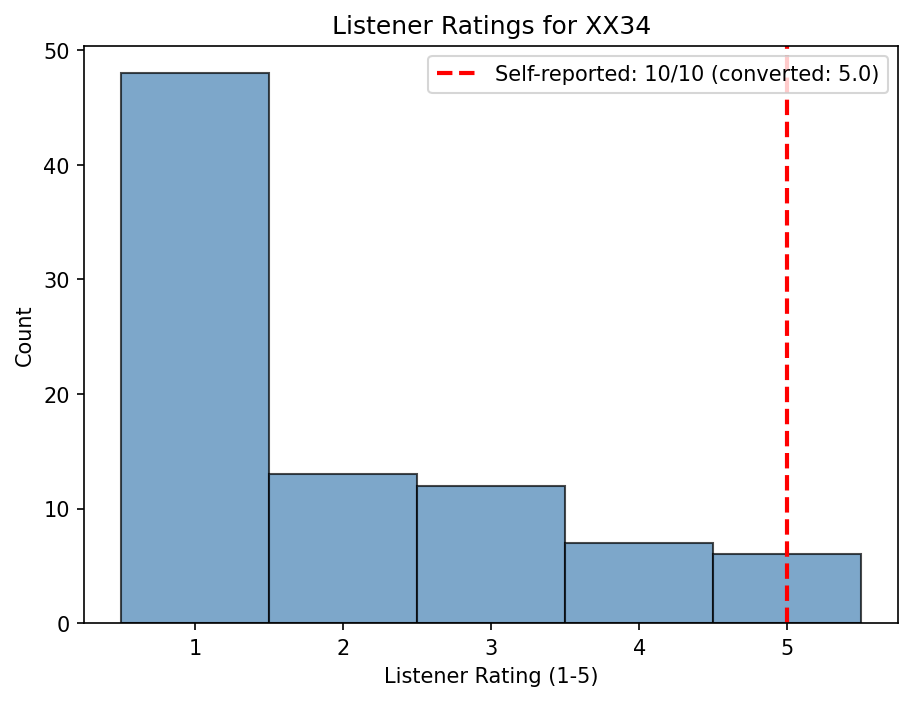
Speaker XX34
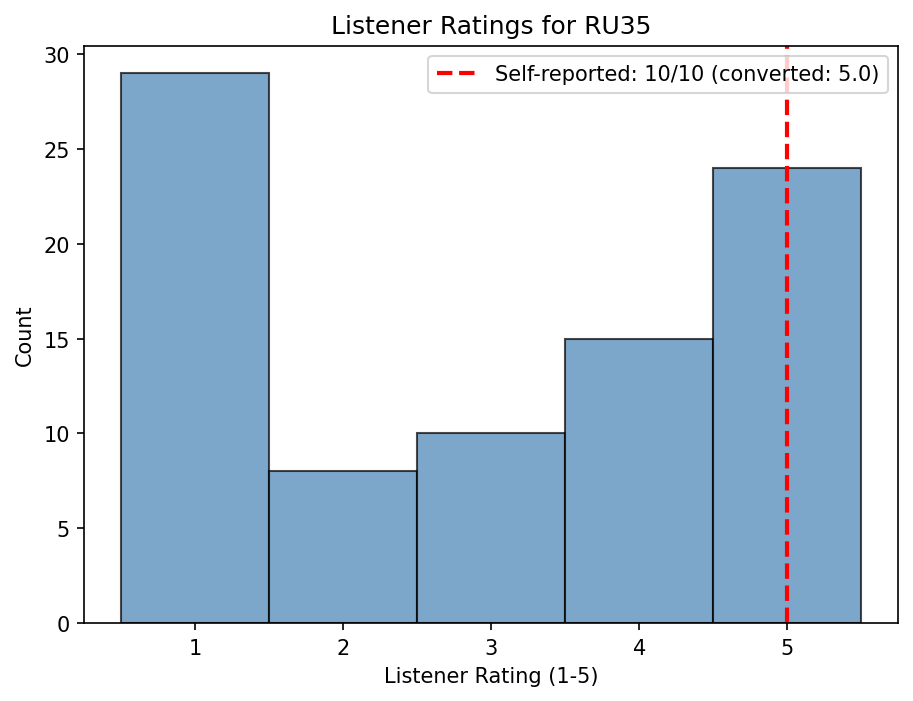
Speaker RU35

Speaker QI36